Parametric Distribution Fitting
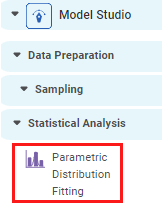
Parametric Distribution Fitting is located under Model Studio (  ) in Statistical Analysis, in the left task pane. Use the drag-and-drop method to use the algorithm in the canvas. Click the algorithm to view and select different properties for analysis.
Refer to Properties of Parametric Distribution Fitting.
Properties of Parametric Distribution Fitting
The available properties of Parametric Distribution Fitting are as shown in the figure given below.
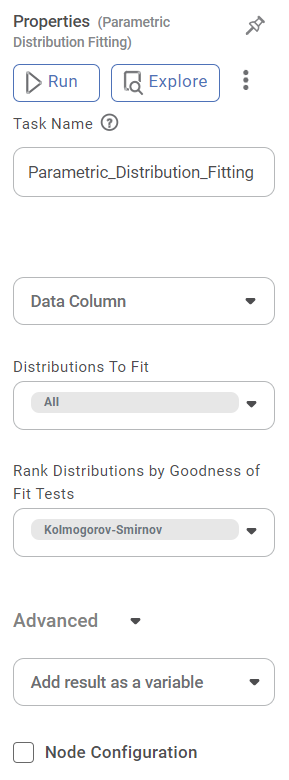
The table given below describes the different fields present on the Properties pane of Parametric Distribution Fitting.
Field | Description | Remark | |
| Run | It allows you to run the node. | - | |
| Explore | It allows you to explore the successfully executed node. | - | |
| Vertical Ellipses | The available options are
| - | |
Task Name | It is the name of the task selected on the workbook canvas. | You can click the text field to edit or modify the name of the task as required. | |
Data Column | It allows you to select the column on which you want to apply Parametric Distribution Fitting. | Only a numerical column can be selected. | |
Distributions to Fit | It allows you to select the various distributions to fit the data. |
o Beta o Cauchy o Exponential o Exponentially modified Normal o Exponentiated Wiebull o F o Gamma o Log-normal o Logistic o Normal o Pearson type III o Uniform o Weibull maximum o Weibull minimum
| |
Rank Distributions by Goodness of Fit Tests | It allows you to rank the best fit distributions by the Goodness of Fit tests. |
o Kolmogorov-Smirnov o Chi square o Anderson Darling
| |
Advanced | Node Configuration | It allows you to select the instance of the AWS server to provide control on the execution of a task in a workbook or workflow. | For more details, refer to Worker Node Configuration. |
Example of Parametric Distribution Fitting
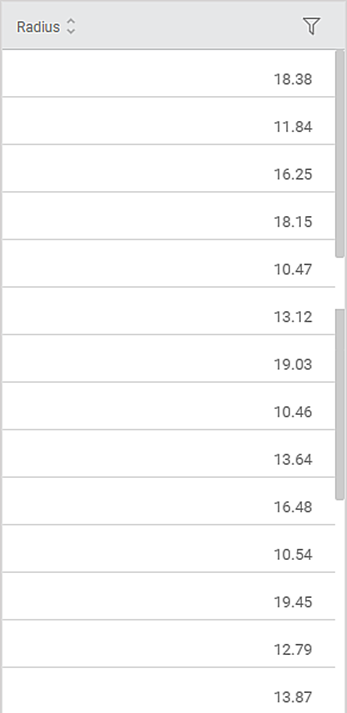
Consider a dataset of a disk radius. A snippet of input data is shown in the figure given below.
The Properties selected for Parametric Distribution Fitting are shown in the table below.
Property | Value |
Data Column | radius |
Distributions to Fit | All |
Rank Distributions by Goodness of Fit Tests | Kolmogorov-Smirnov |
The various elements of the Result page are shown in the figures below.
The Result page displays Descriptive Statistics and Shapiro Wilk’s Test for Normality, as shown in the figure below.

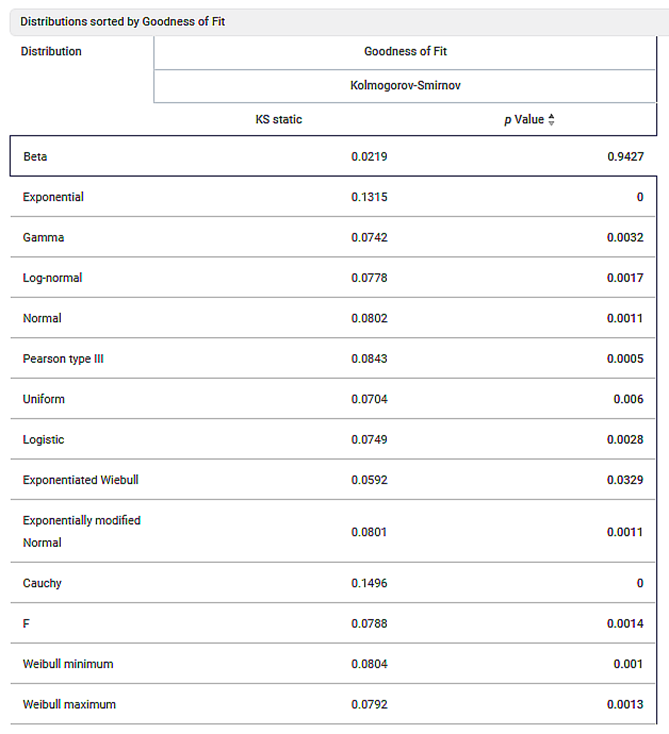
It also displays Distributions sorted by the Goodness of Fit scores, as shown in the figure below.
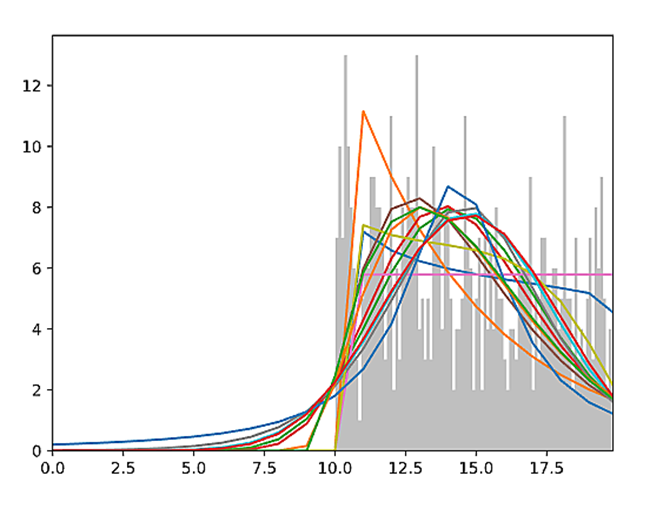
A Histogram of the frequency of values for the selected column with Sample Distribution and Beta Distribution is also displayed.
The Result page also displays PP Plot and QQ Plot, as shown in the figure below:
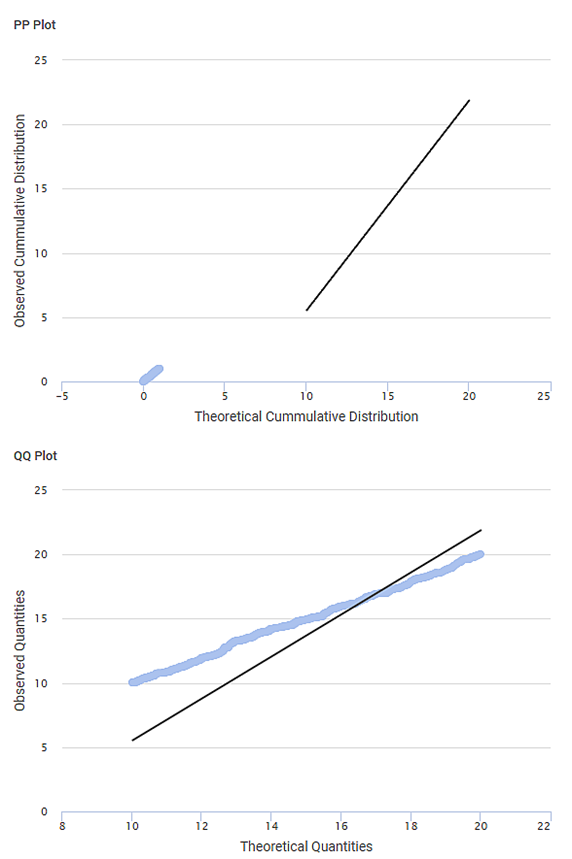
PP Plot (Probability-Probability Plot) is a probability plot to assess how closely two datasets agree. It plots the two cumulative distribution functions against each other. PP Plots are used to evaluate the skewness of a distribution.
QQ Plot (Quartile-Quartile Plot) is a plot of two quartiles against each other. A quartile is a fraction where certain values of the dataset fall below that quartile and certain values are above it. Thus, QQ Plot shows the percentiles of a standard normal distribution against the corresponding percentile of the observed data.
Some important points about Parametric Distribution Fitting -
- This feature helps you to determine which Distribution fits best on your data.
- The distributions are sorted by the highest values of the p-value for the selected test.
- Not all distributions have the same set of parameters.
- Anderson Darling test to be used only with these distributions – Normal, Exponential, and Logistic.
Related Articles
Inverse Cumulative Distribution Function
Inverse Cumulative Distribution Function is located under Model Studio ( ) in Statistical Analysis, in the left task pane. Use the drag-and-drop method to use the algorithm in the canvas. Click the algorithm to view and select different properties ...Cumulative Distribution Function
Cumulative Distribution Function is located under Model Studio ( ) in Statistical Analysis, in the left task pane. Use the drag-and-drop method to use the algorithm in the canvas. Click the algorithm to view and select different properties for ...Mann Whitney U Test
Mann Whitney U Test is located under Model Studio ( ) in Statistical Analysis below Hypothesis Test, under Non-Parametric Test in the left task pane. Use the drag-and-drop method or double-click to use the algorithm in the canvas. Click the algorithm ...One Sample Proportion Test
One Sample Proportion Test is located under Model Studio in Statistical Analysis below Hypothesis Test, Parametric Test in the left task pane. Use the drag-and-drop method or double-click to use the algorithm in the canvas. Click the algorithm to ...One Sample Wilcoxon Signed Rank Test
One Sample Wilcoxon Signed Rank Test is located under Model Studio () in Statistical Analysis below Hypothesis Test, under Non-Parametric Test in the left task pane. Use the drag-and-drop method or double-click to use the algorithm in the canvas. ...