Process Capability Analysis
 ) under Statistical Analysis, in the left task pane. Use the drag-and-drop method to use the algorithm in the canvas. Click the algorithm to view and select different properties for analysis. Refer to Properties of Process Capability Analysis.
Properties of Process Capability Analysis
The available properties of Process Capability Analysis are as shown in the figure given below.
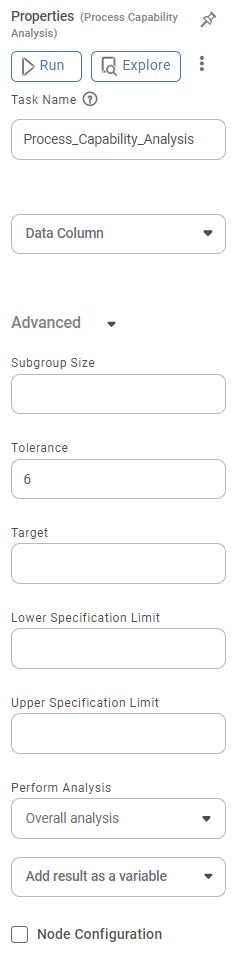
The table given below describes the different fields present on the Properties pane of Process Capability Analysis.
Field | Description | Remark | |
| Run | It allows you to run the node. | - | |
| Explore | It allows you to explore the successfully executed node. | - | |
| Vertical Ellipses | The available options are
| - | |
Task Name | It is the name of the task selected on the workbook canvas. | You can click the text field to edit or modify the name of the task as required. | |
Data Column | It allows you to select the column on which you want to apply Process Capability Analysis. |
| |
Advanced | Subgroup Size | It allows you to set the number of subgroups in which you want to divide the original dataset for processing. |
|
Tolerance | It allows you to set the Tolerance value. |
| |
Target | It allows you to set the expected value for the selected column. | The value of the process target helps in calculating Cpm. If you do not specify the target value, Cpm will not be calculated. | |
Lower Specification Limit | It allows you to set the minimum acceptable value for the process. | — | |
Upper Specification Limit | It allows you to set the maximum acceptable value for the process. | — | |
Perform Analysis | It allows you to select whether the analysis is to be made on the entire dataset or the subgroups. |
| |
Node Configuration | It allows you to select the instance of the AWS server to provide control on the execution of a task in a workbook or workflow. | For more details, refer to Worker Node Configuration. | |
Example of Process Capability Analysis
Consider a dataset of a manufacturing process containing dimensions of a disk produced using three different methods under different conditions. A snippet of input data is shown in the figure given below.
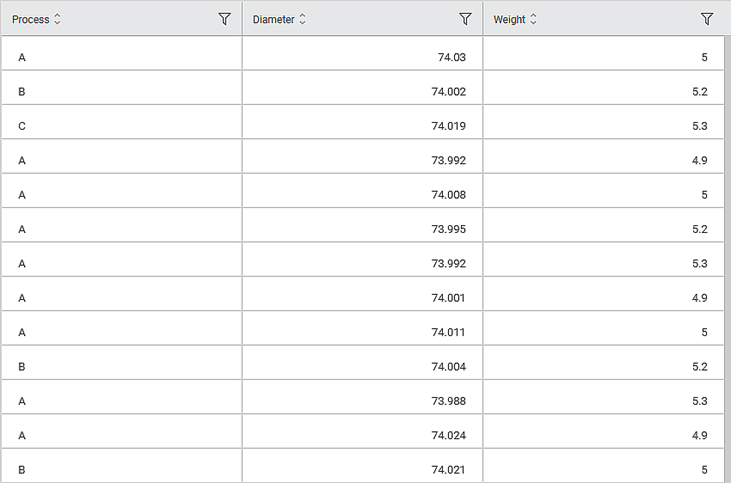
The selected values for properties of Process Capability Report are given in the table below.
Property | Value |
Data Column | Diameter |
Subgroup Size | 5 |
Tolerance | 6 |
Target | 74.00 |
Lower Specification Limit | 73.95 |
Upper Specification Limit | 74.05 |
Perform Analysis | Overall analysis |
The Process Capability Report on the Result page of the Process Capability Analysis is displayed in the figure below.
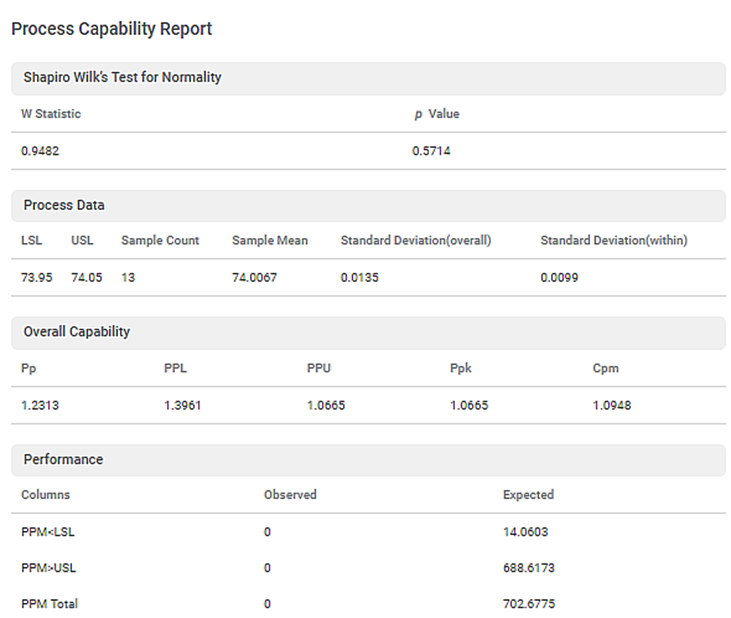
As seen in the above figure, Shapiro Wilk’s Test for Normality statistics is displayed along with Process Data, Overall Capacity, and Performance metrics on the Result page.
The Performance table shows Observed and Expected PPM values below Lower Specification Limit and PPM above Upper Specification Limit.
The table below describes the various performance metrics on the result page.
Performance Metric | Description | Remarks |
Overall Capability | ||
Pp (Process Performance) | It measures actual performance rather than potential. | — |
PPL (Process Performance Lower) | It is used to analyze a system’s performance in meeting lower specification limits. | — |
PPU (Process Performance Upper) | It is used to analyze a system’s performance in meeting upper specification limits. | — |
Ppk | It signifies the system’s performance to meet specifications. The values lie between 0 and 1. Not all processes’ output meet specifications. | Small values indicate deviation from the specification is large whereas, larger values indicate deviation from the specification is small. |
Cpm | If your process has a target, the Cpm is calculated. It is a capability index that also considers how much the data deviates from the target. | It is a measure of the overall capability of the process. It compares the specification spread to the spread of your process while considering how much the data deviates from the target value. |
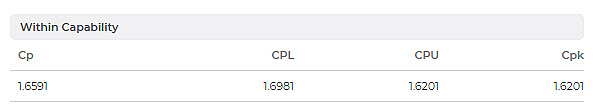
Within Capability | ||
Cp (Process Capability) | It is the measure of the capability of the process. | It tells you how much potential the system has for meeting upper and lower specification limits. |
CPL (Process Capability Lower) | It is a measure of the potential capability of the process based on the lower specification limit. | It considers both - process mean and process spread. It evaluates both the location and variation within subgroups of the process. |
CPU (Process Capability Upper) | It is a measure of the potential capability of the process based on the upper specification limit. | It considers both - process mean and process spread. It evaluates both the location and variation within subgroups of the process. |
CPk | It refers to the capability of a particular process has of achieving output within certain specifications.
| It describes the ability of a manufacturer to produce a product that meets customer expectations within a tolerance zone. Cpk > 1: The system is producing within specification limits. Cpk < 1: The System is producing outside specification limits. |
If property Perform Analysis is set to Within subgroup analysis, then Within Capability table is displayed instead of Overall Capability as shown in the figure below.
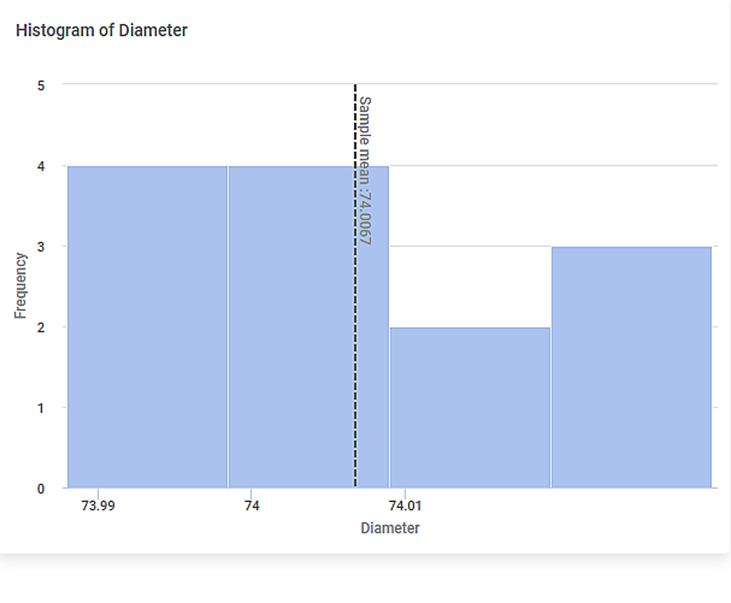
The Result page also displays a Histogram of the values of the selected column and their corresponding frequencies as shown in the figure below.
Related Articles
Factor Analysis
Factor Analysis is located under Model Studio ( ) in Data Preparation, in the left task pane. Use the drag-and-drop method to use the algorithm in the canvas. Click the algorithm to view and select different properties for analysis. Refer to ...Factor Analysis
Factor Analysis is located under Model Studio ( ) in Data Preparation, in the left task pane. Use the drag-and-drop method to use the algorithm in the canvas. Click the algorithm to view and select different properties for analysis. Refer to ...Basic Sentiment Analysis
Basic Sentiment Analysis is located under Textual Analysis ( ) in Sentiment, in the task pane on the left. Use drag-and-drop method to use algorithm in the canvas. Click the algorithm to view and select different properties for analysis. Refer to ...Basic Sentiment Analysis
Basic Sentiment Analysis is located under Textual Analysis ( ) in Sentiment, in the task pane on the left. Use drag-and-drop method to use algorithm in the canvas. Click the algorithm to view and select different properties for analysis. Refer to ...PCA – Principal Component Analysis
Overview Principal Component Analysis (PCA) reduces high‑dimensional data into fewer components while retaining most variance. It helps simplify data, remove noise, and prepare it for further modeling. Where to Find PCA Pipeline → Model Studio → Data ...