Random Forest Regression
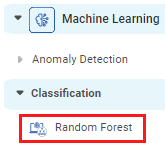
Random Forest Regression is located under Machine Learning (  ) > Regression > Random Forest Regression
Use the drag-and-drop method (or double-click on the node) to use the algorithm in the canvas. Click the algorithm to view and select different properties for analysis.
Properties of Random Forest Regression
The available properties of the Random Forest Regression are as shown in the figure below.
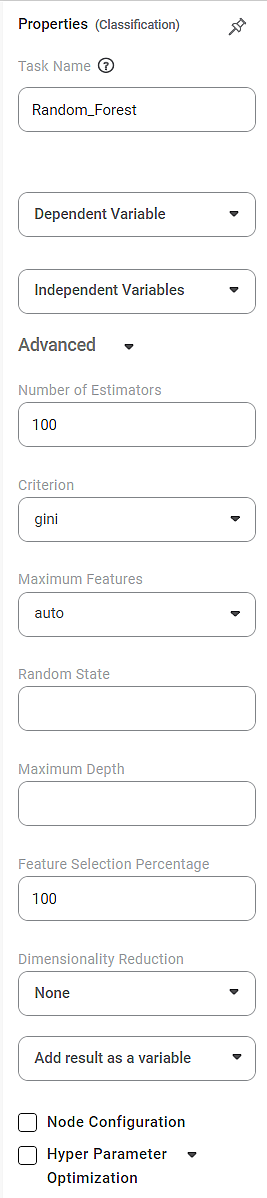
The table given below describes the different fields present on the properties pane of Random Forest Regression.
Field | Description | Remark |
Run | It allows you to run the node. | – |
Explore | It allows you to explore the successfully executed node. | – |
Vertical Ellipse | The available options are
| – |
Task Name | It displays the name of the selected task. | You can click the text field to edit or modify the task's name as required. |
Dependent Variable | It allows you to select the variable from the drop-down list for which you need to predict the values of the dependent variable y. |
|
Independent Variable | It allows you to select the experimental or predictor variable(s) x. |
|
Advanced | ||
Number of Estimators | It allows you to select the number of decision trees that are part of the forest. | The default value is 100. |
Criterion | It allows you to select the Decision-making criterion to be used. |
|
Maximum Features | It allows you to select the maximum number of features to be considered for the best split. |
|
Random State | It allows you to enter the seed of the random number generator. | - |
Maximum Depth | It allows you to enter the maximum tree depth for base learners. | The default value is "None". |
Minimum Samples Leaf | The minimum number of samples (data points) required to create a leaf node in each decision tree within the random forest | The default value is 1. |
Minimum Samples Split | It controls the minimum number of samples required to split an internal node (a decision tree node) into child nodes. | The default value is 2. |
Dimensionality Reduction | It allows you to select the dimensionality reduction option.
|
|
Add result as a variable | It allows you to select whether the result of the algorithm is to be added as a variable. | For more details, refer to Adding Result as a Variable. |
Node Configuration | It allows you to select the instance of the AWS server to provide control over the execution of a task in a workbook or workflow. | For more details, refer to worker node configuration. |
Hyper Parameter Optimization | It allows you to select parameters for optimization. | For more details, refer to Hyperparameter Optimization. |
Example of Random Forest Regression
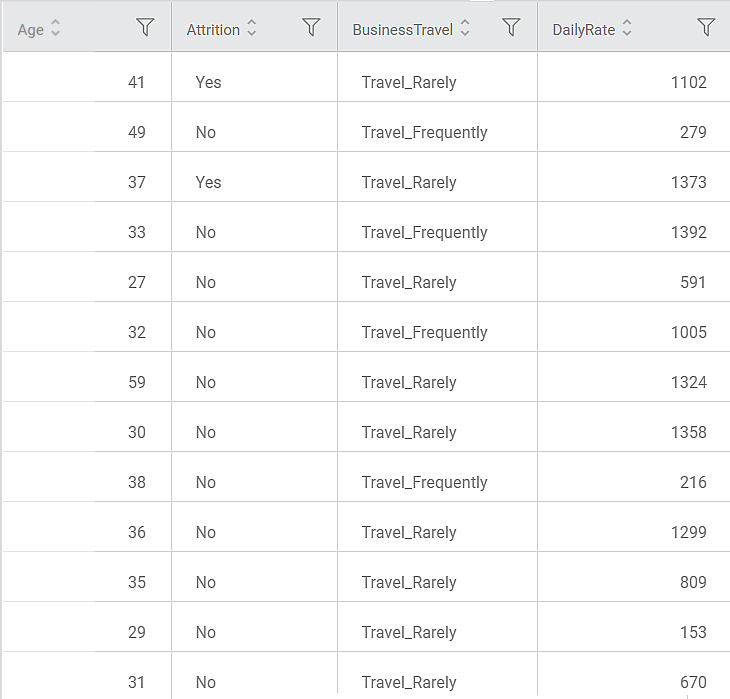
Let's use the penguin dataset to predict the body mass of a penguin from its bill length, flipper length, species, gender, and Iceland.
The snippet below is the workflow and the algorithm properties.
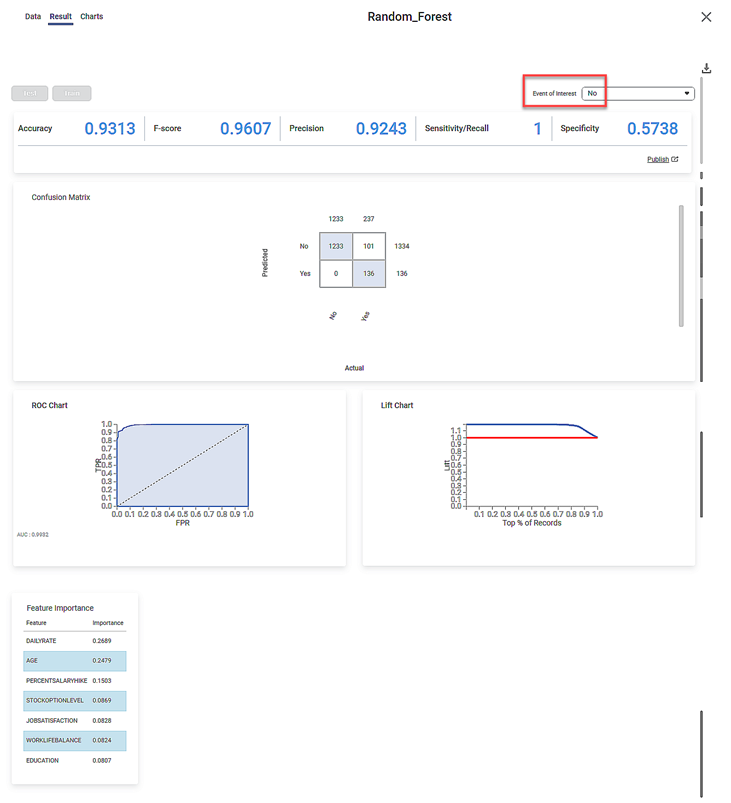
The result page of the random forest regression is shown below.
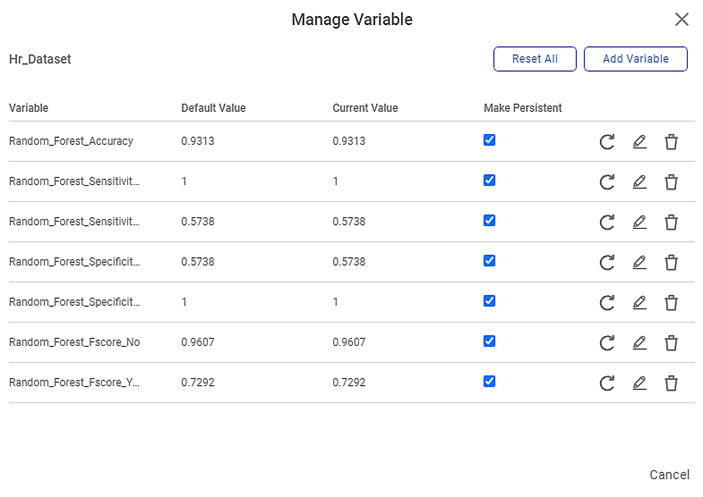
Below snippet shows the predicted and actual value of the body mass (g).
Related Articles
Random Forest
Random Forest is located under Machine Learning ( ) in Classification, in the left task pane. Use the drag-and-drop method (or double-click on the node) to use the algorithm in the canvas. Click the algorithm to view and select different properties ...Lasso Regression
Lasso Regression is located under Machine Learning ( ) in Regression, in the left task pane. Use the drag-and-drop method to use the algorithm in the canvas. Click the algorithm to view and select different properties for analysis. Refer to ...Ridge Regression
Ridge Regression is located under Machine Leaning ( ) under Regression, in the left task pane. Use the drag-and-drop method to use the algorithm in the canvas. Click the algorithm to view and select different properties for analysis. Refer to ...Decision Tree Regression
Decision Tree Regression is located under Machine Learning ( ) > Regression > Decision Tree Regression Use the drag-and-drop method (or double-click on the node) to use the algorithm in the canvas. Click the algorithm to view and select different ...Binomial Logistic Regression
Binomial Logistic Regression is located under Machine Learning () in Data Classification, in the task pane on the left. Use drag-and-drop method to use the algorithm in the canvas. Click the algorithm to view and select different properties for ...