Hyperparameter Optimization
Hyperparameter Optimization is used for better Optimization of given dataset. This feature provides you with the list of parameters that will give best solution for your dataset among the parameters were provided for optimizing the solution. You can select more than one parameter from the list for Hyper Parameter Optimization.
Hyperparameter Optimization can be applied on both Classification as well as Regression algorithms.
To perform the hyper parameter Optimization, follow the steps given below.
- Open a Workbook. Refer to Opening a Workbook.
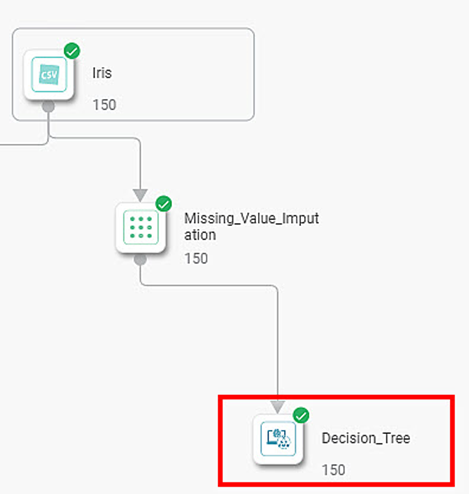
- Build your Algorithm flow in workbook canvas.
- Select the algorithm node.
The Properties pane is displayed on the right side.
- Select the Dependent and Independent variables.
- Select the rest of the parameters based on the algorithm selected.
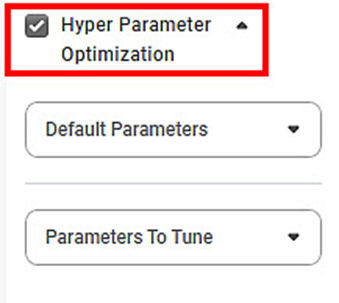
- Select the Hyper Parameter Optimization check box.
The list of parameters is displayed.
There are two categories of Parameters:- Default Parameters
- Parameters to Tune
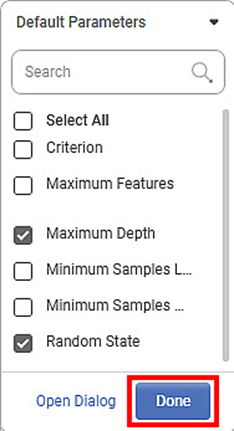
- Click Default Parameters drop-down () to select default parameters.
- Select the desired parameters from the list and click Done.
After selecting the parameters to tune, enter their values.
Notes:
- For categorical parameters, select the values from the respective drop-down. For numerical parameters, enter the value.
- For default parameters, you can select only one value for each of the parameters.
After selecting the parameters to tune, enter their values.
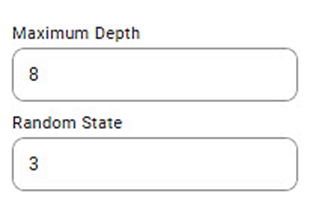
A sample parameter selection is displayed below.
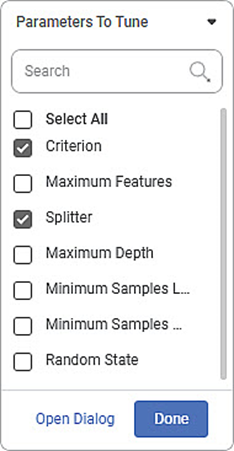
- Click Parameters to Tune drop-down () to select default parameters.
- Select the desired parameters from the list, and then click Done.
After selecting the parameters to tune, enter their values.
Notes
- For categorical parameters, select the values from the respective drop-down. For numerical parameters, enter the value.
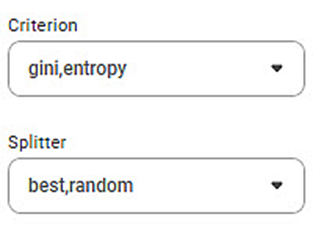
- For parameters under Parameters to Tune, you can select more than one values for each of the parameters. You can enter comma separated multiple values.
A sample parameter selection is displayed below.- Save the Workbook.
Run the Workbook. Refer to Running a Workbook.
Note:
If you select the Hyper Parameter Optimization check box but run the workbook without selecting the Default Parameters and Parameters To Tune, you will not get results.
After the workbook execution is complete, a confirmation message is displayed.
- Select the algorithm node, click the ellipsis, and then click Explore.
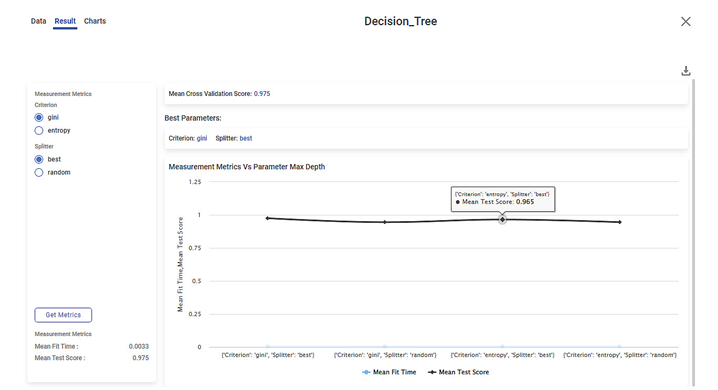
The result is displayed.
You can change the parameters and Metrix as required and view the results for different values of the selected parameters.
Related Articles
Model Compare
Model Compare is a feature, which is used to compare the performance of Classification and Regression algorithms. You can select the performance metrics on which the comparison is to be done. Based on the performance metrics results, Rubiscape ...MLP (Multi-Layer Perceptron) Neural Network in Regression
MLP (Multi-Layer Perceptron) Neural Network in Regression Description An MLP neural network for regression is designed to predict continuous numerical values. It consists of multiple layers, including an input layer, one or more hidden layers, and an ...Support Vector Machine In Regression
Support Vector Machine In Regression Description The Support Vector Machine (SVM) approach for regression is a machine learning technique that seeks to identify a hyperplane that closely resembles the regression function. It reduces deviations ...Rubiscape Spring '24
Published On: 18 June 2024 New Features Rubiscape Workspace Level Export/Import: Workspace export functionality available for tenant admin users. Rubiscape users can import required entities into any existing or new workspace. Rubiscape File Server ...Machine Learning Concepts
Advanced Entity Extraction Advanced entity extraction, also known as entity recognition, is used to extract vital information for natural language processing (NLP). It is widely used for finding, storing and sorting textual content into default ...
