SARIMA
SARIMA is located under Forecasting(  ) in Modeling, in the left task pane. Use the drag-and-drop method to use the algorithm in the canvas. Click the algorithm to view and select different properties for analysis.
Refer to Properties of SARIMA.
ARIMA supports data with a trend but no seasonality. SARIMA explicitly handles the seasonal component in the univariate data. Thus, SARIMA effectively forecasts time series with univariate data containing trends and seasonality. While applying SARIMA, the hyperparameters of both the trend and seasonal elements are configured. These are,
- Trend Elements: p, d, and q
- Seasonal Elements: P, D, and Q
Properties of SARIMA
The available properties of SARIMA are as shown in the figures given below. Figure below shows the basic configurations for SARIMA.
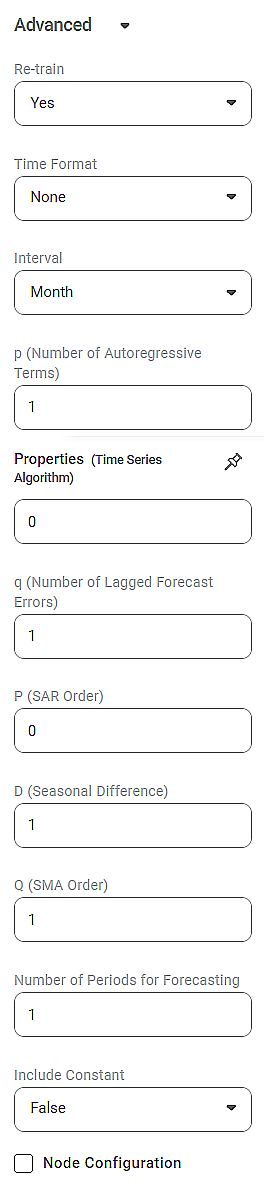
Figure below shows the configuration of advanced properties of SARIMA. They include the trend and seasonal elements, the number of periods to be forecasted, and a regressive constant.
The table given below describes the different fields present on all the properties of SARIMA.
Field | Description | Remark | |
|---|---|---|---|
| Run | It allows you to run the node. | - | |
| Explore | It allows you to explore the successfully executed node. | - | |
| Vertical Ellipses | The available options are
| - | |
Task Name | It is the name of the task selected on the workbook canvas. |
| |
Time ID Variable | It allows you to select the time variable. | The dataset should contain at least one time variable. | |
Target Variable | It allows you to select the variable for performing the SARIMA. | The variable selected should be discrete. | |
Group By | It allows you to select the function for grouping identical data. |
| |
Advanced | Re-train | It allows you to select whether you want to re-train the SARIMA model. |
|
Time Format | It allows you to select the time format for the Time ID variable. | – | |
Interval | It allows you to select the interval you want to calculate the SARIMA. |
| |
p | It allows you to select the Number of Autoregressive Terms. |
| |
d | It allows you to select the Number of Nonseasonal Differences. |
| |
q Number of Lagged Forecast Errors | It allows you to select the Number of Lagged Forecast Errors. |
| |
P | It allows you to select the SAR Order, the seasonal autoregressive order. |
| |
D | It allows you to select the Seasonal Difference. |
| |
Q | It allows you to select the SMA Order, the seasonal moving average order. |
| |
Number of Periods for Forecasting | It allows you to select a specific number of periods you want to forecast based on the SARIMA results. |
| |
Include Constant | It allows you to choose whether you want to include the constant of the regression analysis equation. |
| |
Node Configuration | It allows you to select the instance of the AWS server to provide control on the execution of a task in a workbook or workflow. | For more details, refer to Worker Node Configuration. | |
Example of SARIMA
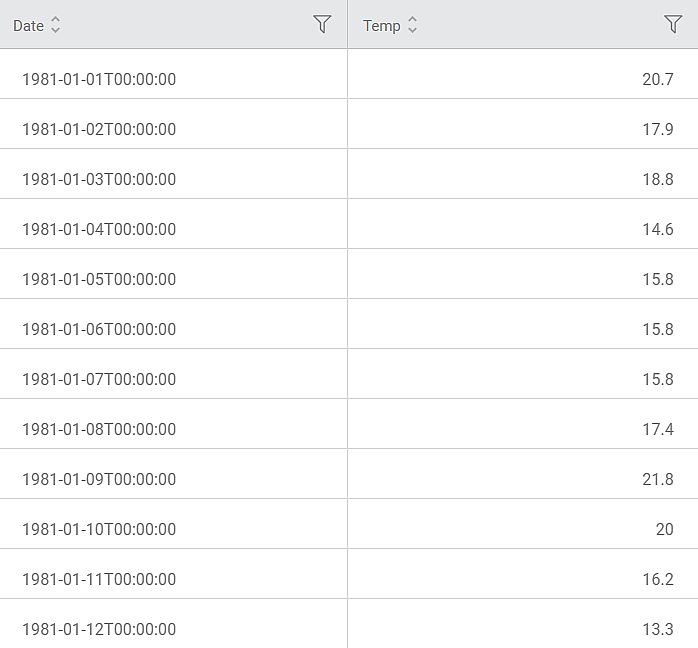
Consider a Temperature dataset with 10 records. It contains columns for Date and corresponding daily temperature. A snippet of the input data is shown in the figure given below.
We apply SARIMA to the input data. The selected values for SARIMA are given below.
Property | Value | Property | Value |
Time ID Variable | Date | q | 1 |
Target Variable | Temp | P | 0 |
Group By | — | P | 1 |
Retrain | Yes | D | 1 |
Time Format | 12-13-1947 | Q | 1 |
Interval | Month | Number of Periods for Forecasting | 1 |
p | 1 | Include Constant | False |
d | 0 |
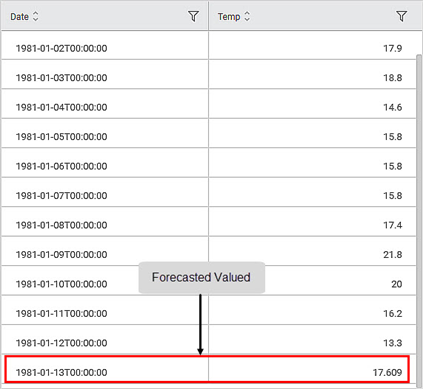
On the Data pane, you see the forecasted value for the last month.
Further, the Result page displays
- Forecasting plot of the variation in temperature with Date
- Forecasted Value at the end of the plot
- Standard Error in the calculation of the forecasted value.
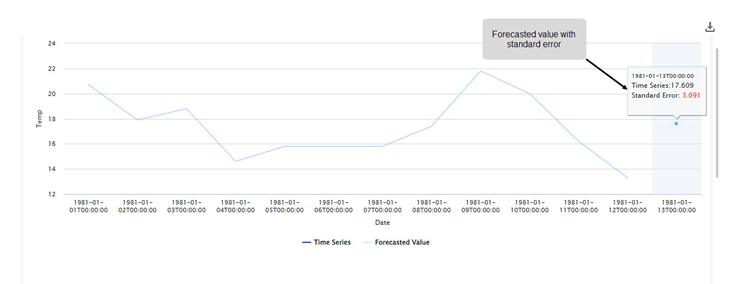
As you can see, the forecasted temperature value for 1981-01-13 is 17.609 with a standard error of 3.091.
Related Articles
Components in Forecasting
Forecasting deals with the analysis and detection of trends in the time-series data. The components of forecasting are, Data Exploration: Data Exploration is used to explore the time-series data. It helps in identifying the underlying parameters ...