Shapiro Wilk Test
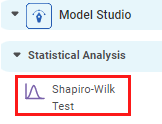
Shapiro-Wilk Test is located under Model Studio (  ) in Statistical Analysis in the task pane on the left. Use the drag-and-drop method (or double-click on the node) to use the algorithm in the canvas. Click the algorithm to view and select different properties for analysis.
Refer to Properties of Shapiro-Wilk Test.
Properties of Shapiro-Wilk Test
The available properties of the Shapiro-Wilk Test are as shown in the figure given below.
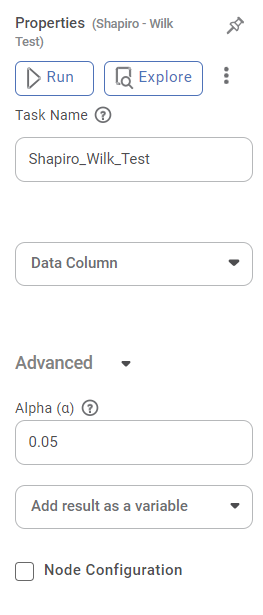
The table given below describes the different fields present on the Properties pane of the Shapiro-Wilk Test.
Field | Description | Remark | |
| Run | It allows you to run the node. | - | |
| Explore | It allows you to explore the successfully executed node. | - | |
| Vertical Ellipses | The available options are
| - | |
Task Name | It displays the name of the selected task. | You can click the text field to edit or modify the name of the task as required. | |
Data Column | It allows you to select the numerical variable for which you need to perform the task. | · Only numerical values are available. · Only one data field can be selected. | |
Advanced | Alpha | It allows you to set the level of significance. | The default value is 0.05. |
Node Configuration | It allows you to select the instance of the AWS server to provide control on the execution of a task in a workbook or workflow. | For more details, refer to Worker Node Configuration. | |
Example of Shapiro-Wilk Test
Consider a dataset of the count of the chemical composition of wine sample. A snippet of input data is shown in the figure given below.
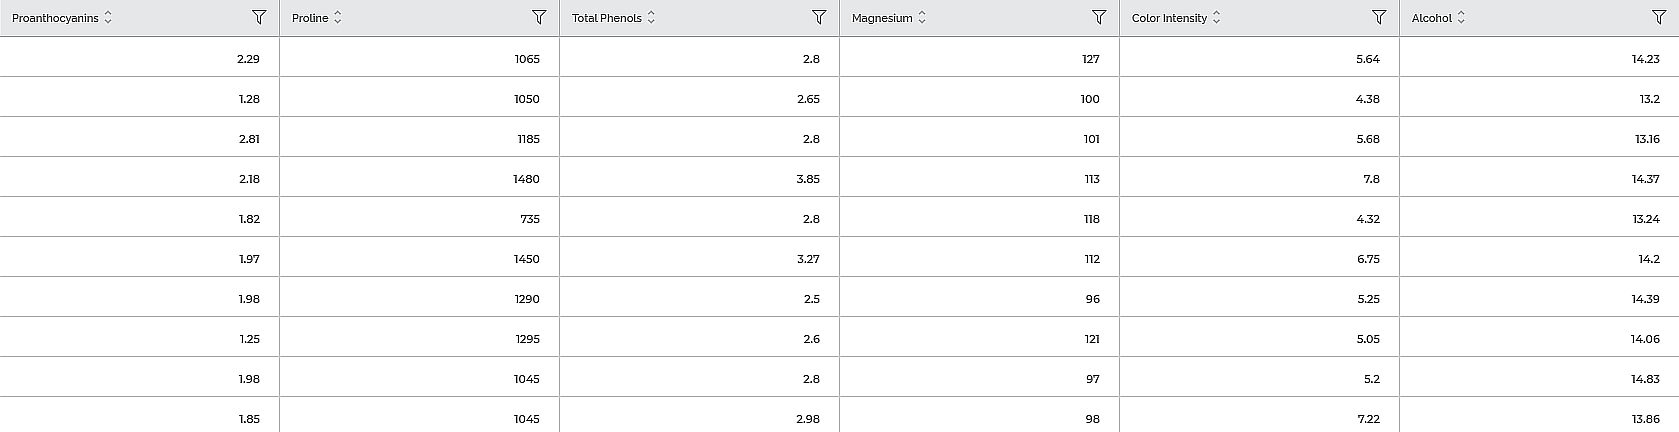
In the Properties pane of the Shapiro-Wilk Test, the value selected in Data Column is Alcohol.
The Result page of the Shapiro-Wilk Test is shown in the figure given below.
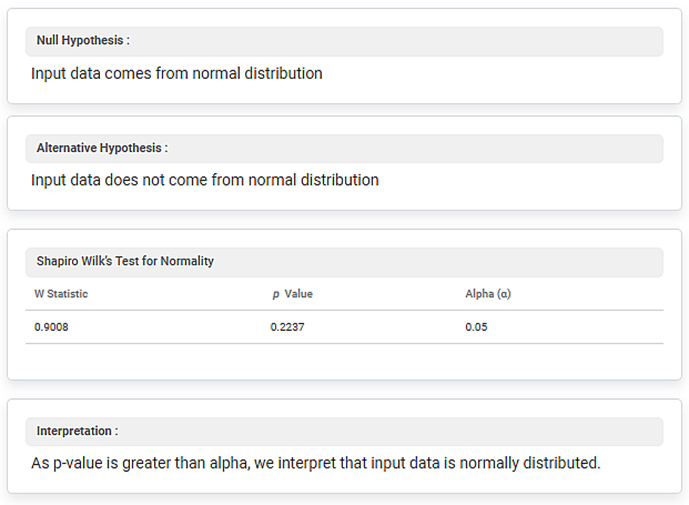
The Result page displays the Null Hypothesis and Alternative Hypothesis. It also displays the W Statistic, p-Value, and Alpha (α) under Shapiro Wilk’s Test for Normality metrics.
In the above example, the value of the W Statistic is 0.9008, p-Value is 0.2237, and Alpha is 0.05.
Thus, you can see that the p value is more than the value of alpha. Hence, the input data is normally distributed.
Related Articles
Two Way ANOVA
Two Way ANOVA is located under Model Studio ( ) in ANOVA Analysis under Statistical Analysis, in the task pane on the left. Use the drag-and-drop method to use the algorithm in the canvas. Click the algorithm to view and select different properties ...One Way ANOVA
One Way ANOVA is located under Model Studio ( ) in ANOVA Analysis under Statistical Analysis, in the task pane on the left. Use the drag-and-drop method to use the algorithm in the canvas. Click the algorithm to view and select different properties ...Johnson Transformation
Johnson transformation is located under Model Studio > Statistical Analysis > Johnson Transformation. on the left task pane. Use the drag-and-drop method (or double-click on the node) to use the algorithm in the canvas. Click the algorithm to view ...Two Sample Z Test
Two Sample Z Test Description Two sample Z test is a statistical test used to determine whether there is a significant difference between the means of two independent variables. Why to use To compare the means of two independent variables When to use ...Box Cox Transformation
Box-Cox Transformation is located under Model Studio > Statistical Analysis > Box Cox Transformation. Alternatively, use the search bar to find the Box-Cox Transformation test feature. Use the drag-and-drop method or double-click to use the algorithm ...