SMOTE
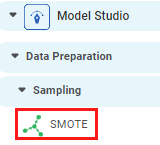
SMOTE is located in Model Studio ( ) under Data Preparation in Sampling, in the left task pane. Use the drag-and-drop method (or double-click on the node) to use the algorithm in the canvas. Click the algorithm to view and select different properties for analysis.
Refer to Properties of SMOTE.
Properties of SMOTE
The available properties of SMOTE are as shown in the figure given below.
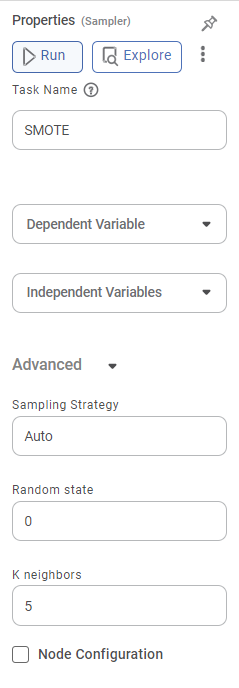
The table given below describes the different fields present on the Properties pane of SMOTE.
Field | Description | Remark | |
| Run | It allows you to run the node. | - | |
| Explore | It allows you to explore the successfully executed node. | - | |
| Vertical Ellipses | The available options are
| - | |
Task Name | It displays the name of the task selected on the workbook canvas. | You can click the text field to edit or modify the name of the task as required. | |
Dependent Variables | It allows you to select the dependent variable. |
| |
Independent variables | It allows you to select the experimental or predictor variable(s). |
| |
Advanced | Sampling Strategy | It allows you to enter the sampling strategy for the selected dependent variable. |
|
Random state | It allows you to enter the random state value. |
| |
K neighbors | It allows you to enter the number of closest training samples in the feature space. |
| |
Example of SMOTE
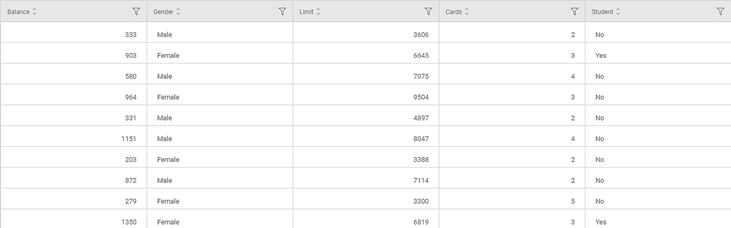
Consider a dataset Credit Card Balance with 13 features and 400 rows. A snippet of the input data is shown in the figure given below.
In the Properties pane of SMOTE, the values selected are given in the table below.
Property | Value |
Dependent Variable | Ethnicity |
Independent Variables | Age, Education, Income, Balance |
Sampling Strategy | Auto |
Random state | 2 |
K neighbors | 5 |
The Result page of SMOTE is shown in the figure given below.
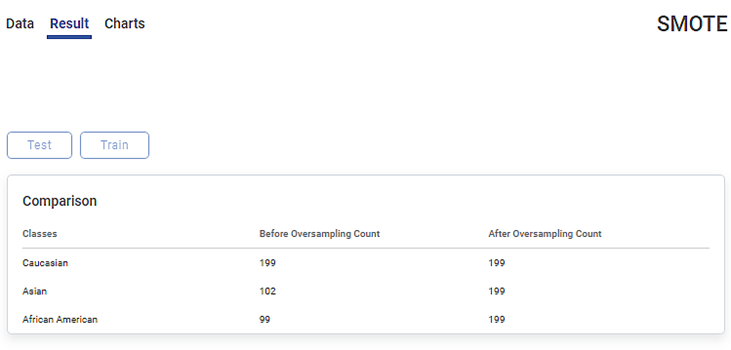
The Result page displays the Comparison table of counts for the classes in the selected dependent variable. In the table, the Classes column lists each class in the selected dependent feature. The first in the list is the majority class, followed by the minority classes in the variable. Here, the dependent variable has three classes: Caucasian, Asian, and African American.
The Before Oversampling Count column displays the count of the data points in each class before oversampling is performed.
The After Oversampling Count column displays the synthetic samples generated for each minority class after oversampling is performed on minority classes. Since the Sampling Strategy is Auto, the count in each minority class in this column is equated to the count in the majority class.
Note: |
|
In the above example,
- Caucasian is the majority class with 199 data points.
- Asian and African American are minority classes with 102 and 99 data points, respectively.
- After oversampling, the number of data points in all the classes is equated to 199.
The output Data page displays one more column, Label along with the existing 13 features in the SMOTE result. Also, it displays 597 rows which include 197 synthetic samples created after the 400th row.
A snippet of the output data with 15 columns and 597 rows, displayed on the Data page, is shown in the figure below.
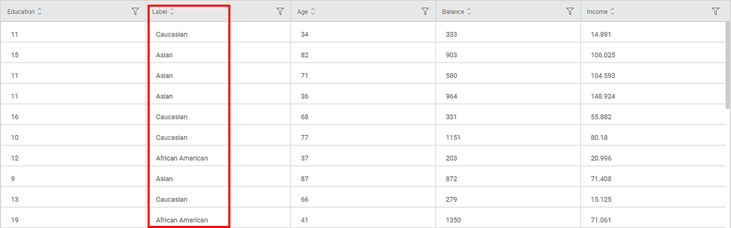
On the Data page,
- The Label column contains values Caucasian, Asian, and African American.
Note: | You can download the data from the output Data page using the download icon in the top-right. |
Example of SMOTE using Train Test Split
Let us consider the dataset Credit Card Balance again, which contains 13 features and 400 rows.
In this example, the SMOTE result is obtained for the input data divided into Train data and Test data.
In the Properties pane of Train Test Split, the value entered for the Test Percentage property is 0.3. This means that the input data is divided into 70% train data and 30% test data.
In the Properties pane of SMOTE, the values selected are given in the table below.
Property | Value |
Dependent Variable | Marriage |
Independent Variables | Age, Education, Income, Balance |
Sampling Strategy | 0.9 |
Random state | 2 |
K neighbors | 5 |
In this example, the dependent variable is a binary variable with values, Yes and No. It contains 280 data points of Yes and 120 data points of No.
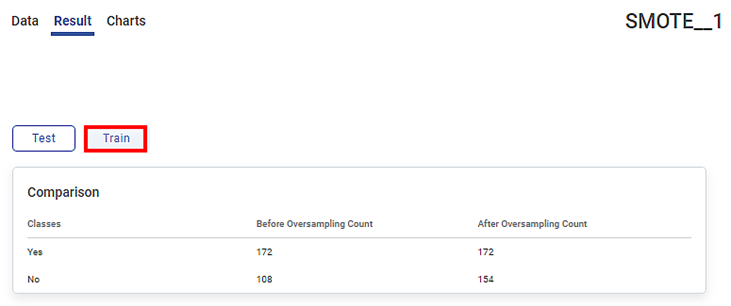
The Result page of SMOTE displays the Train data result as shown in the figure given below.
The Result page of SMOTE for Test data is shown in the figure given below.
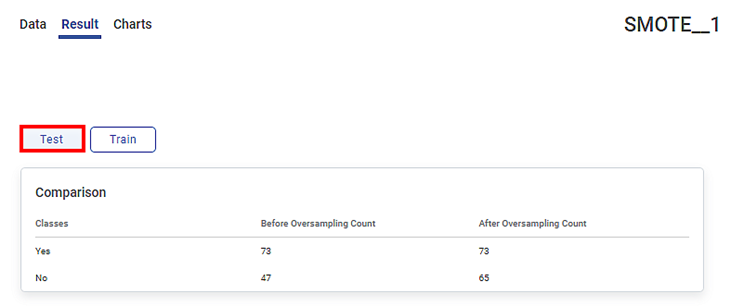
The respective Result page of Train and Test displays the Comparison table of counts for the classes in the dependent variable, Marriage. In the variable, Yes is the majority class and No is the minority class. The data points in each of these classes in Train and Test are divided into 70:30, respectively.
The Before Oversampling Count column displays the count of the data points in each class before oversampling is performed.
- The data points in each class in Train are divided into 70% of 280 and 70% of 120.
- The data points in each class in Test are divided into 30% of 280 and 30% of 120.
The After Oversampling Count column displays the synthetic samples generated for the minority class No after oversampling is performed. Since the Sampling Strategy is 0.9, the count in No in this column is equal to 0.9 times the count in the majority class.
Notes: |
|
The table below describes the counts before and after oversampling on each of the Train and Test Result pages.
| Train | Test | ||||
Before Oversampling
| Class | Yes | No | Class | Yes | No |
Count | 172 | 108 | Count | 73 | 47 | |
Total data points | 280 | Total data points | 120 | |||
After Oversampling | Class | Yes | No | Class | Yes | No |
Count | 172 | 154 | Count | 73 | 65 | |
Total data points | 326 | Total data points | 138 | |||
Synthetic Samples created | 46 | Synthetic Samples created | 18 | |||
- The total synthetic samples created after the oversampling are 64.
- The total number of data points after the oversampling is 464.
The output Data page displays three more columns, Label, Index, and TrainTestTagIntern along with the existing 13 features in the SMOTE result. The output Data page displays 464 rows which include 64 synthetic samples created after the 400th row.
On the Data page,
- The Label column contains values Yes and No.
Note: | You can download the data from the output Data page using the download icon () in the top-right. |
Related Articles
SMOTE
SMOTE is located in Model Studio ( ) under Data Preparation in Sampling, in the left task pane. Use the drag-and-drop method (or double-click on the node) to use the algorithm in the canvas. Click the algorithm to view and select different properties ...