Sorting Data in Widgets
You can sort a widget based on the variables present in the chart. The default sorting of the chart is as per the data from the input dataset.
For charts with legend, if you select a feature as a Legend, the numerical variable plotted on the Y-axis is not available for sorting.
For charts without legend, the numerical variable plotted on the Y-axis is available for sorting.
Sorting can be applied to the following charts/widgets: Column chart, Pie chart, Area chart, Line Chart, Donut chart, Bar chart, Boxplot chart, Stacked column chart, Stacked bar chart, Stacked area chart, Table, Cross Table, Waterfall chart, Combination chart, Sparkline chart and Filter Widget.
Advance Sort
- The sorting of data in a widget helps you to change its appearance. In Rubiscape, you can apply multi-level sorting to multiple widgets. You can
- Arrange data in ascending or descending order.
- Sort the data based on available variables
- Apply sorting to multiple variables at the same time
- Change the sequence in which sorting is applied
To apply advance sort on the data in a widget, create charts as required on the dashboard page. Refer to Creating Charts using Widgets.
For example, we plot a Column Chart for Quantity Count by Region, Category, and Segment in a Sales dataset.
The chart is sorted by default with respect to the Region variable in the Descending order.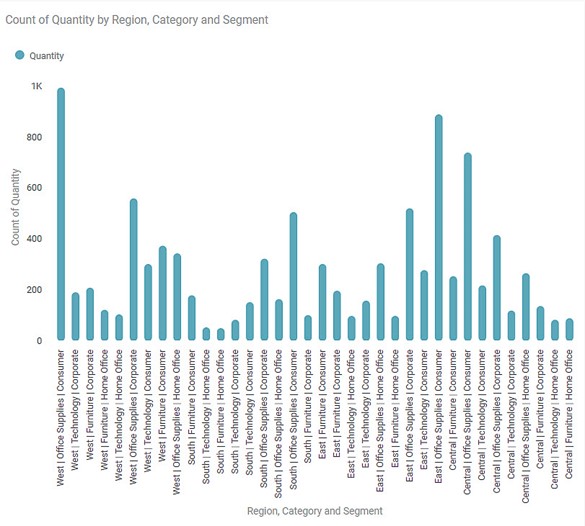
Next,
- Select the widget, and on its top-right corner, click the More Options ellipsis (
 ). The available options are displayed.
 - Click the Advance Sort option.
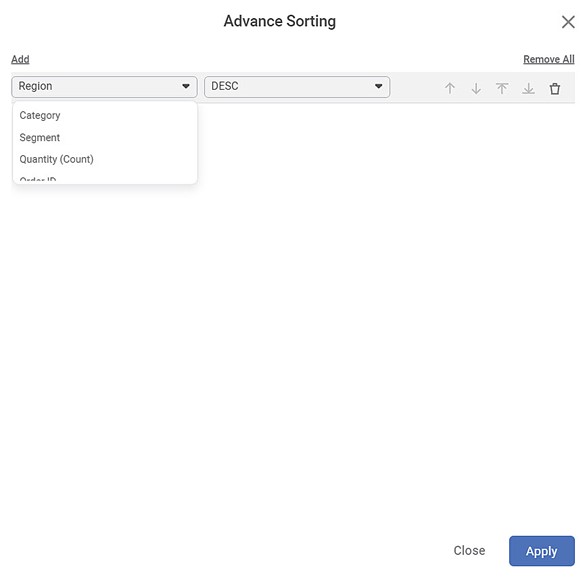
The Advance Sorting window is displayed. You observe that,
- By default, the chart is sorted in Descending order (DESC) with respect to the first categorical variable selected while plotting the chart. In our example, the Column Chart is sorted with respect to Region.
- On clicking the Region drop-down, the other variables, which can be used for sorting, are displayed.
- Since no variable is selected as Legend, all other variables are available to be selected for sorting. In our example, they are Category, Segment, and Quantity (Count). Also, the Legend variable does not appear in the sorting list.
The table below describes the various fields and icons present on the Advance Sorting window.
Field/Icon | Variable Behavior | Description |
|---|---|---|
Add | This field allows you to add a new variable/feature to the sorting list. |
|
| The Move Up arrow allows you to move the variable one place up in the order. | This option is disabled for the variable present at the top of the list. |
| The Move Down arrow you to move the variable one place down in the order. | This option is disabled for the variable present at the bottom of the list. |
| The At Top arrow you to move the variable to the top of the order. | This option is disabled for the variable present at the top of the list. |
| The At Bottom arrow you to move the variable to the bottom of the order. | This option is disabled for the variable present at the bottom of the list. |
| The Delete icon allows you to remove a variable from the list. | You can remove only one variable at a time using this icon. |
Remove All | This option allows you to remove all variable selections from the list at the same time. | After you click Remove All, the default variable and selection and the specified order are retained. |
Close | This option allows you to cancel the selection process and close the window. | When you click Close, the earlier sorting selection or default selection is retained, and you are navigated to the dashboard page. |
Apply | This option allows you to apply the variable and order selection, in the specified order, on the widget. | When you click Apply, the Advance Sort window disappears, and you are navigated to the dashboard page. |


Scenario 1:
All the variables are selected for sorting. The sequence of variables and the order of sorting for each variable are shown below.
According to the sequence, the Column Chart is sorted first by Region in the Descending order, then by Category, and finally by Segment, both in the Ascending order.
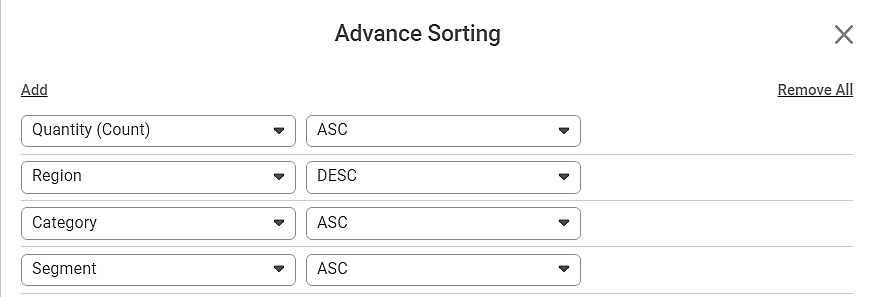
Scenario 2:
All the variables are selected for sorting. The sequence of variables and the order of sorting for each variable are shown below.
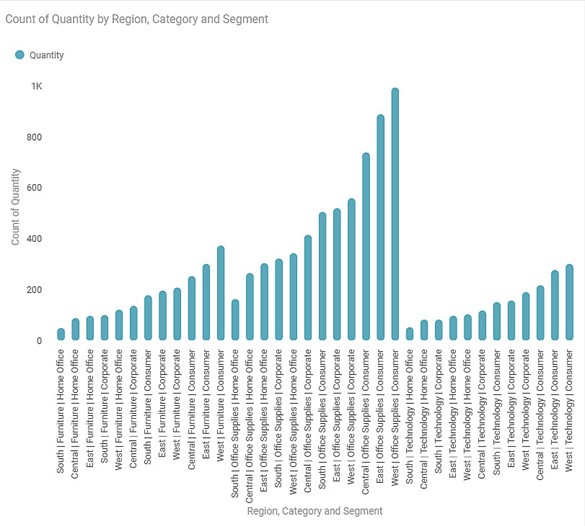
According to the sequence, the Column Chart is sorted first by Category, then by Segment, and finally by Region, all in Ascending order.
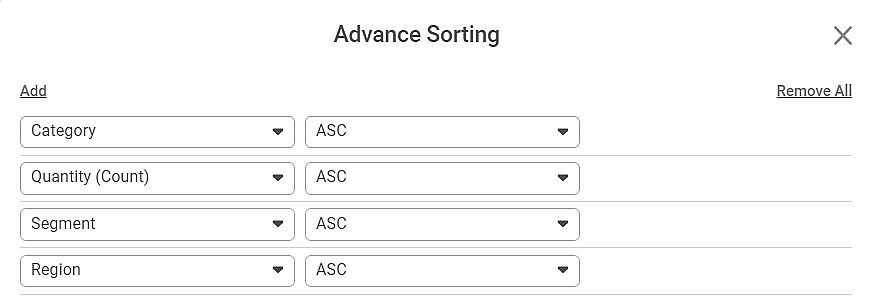

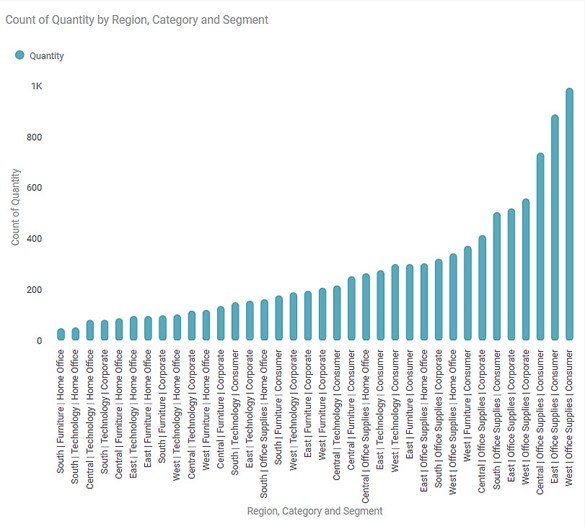
The resultant Column Chart is shown below.

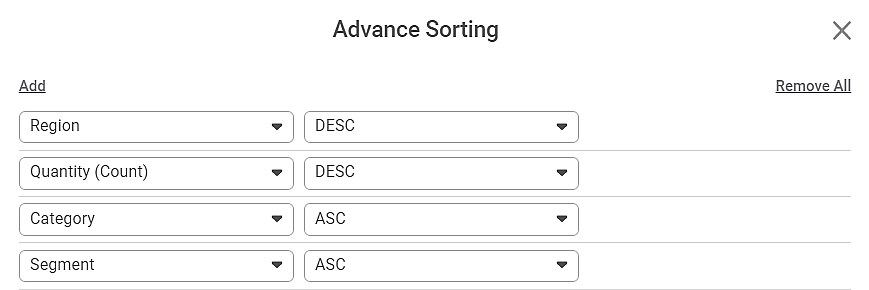
Scenario 3:
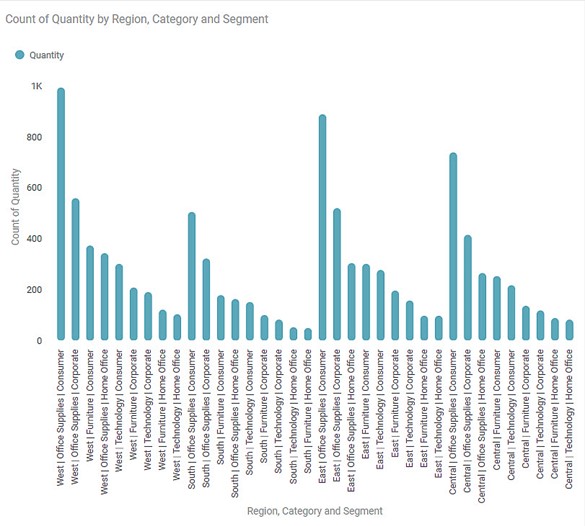
Consider that the Advance Sorting selection is as shown below.

The resultant Column Chart is shown below.

Related Articles
Sorting
Sorting is located under Model Studio ( ) in Data Preparation, in the task pane on the left. Use drag-and-drop method to use the algorithm in the canvas. Click the algorithm to view and select different properties for analysis. Refer to Properties of ...Sorting
Sorting is located under Model Studio ( ) in Data Preparation, in the task pane on the left. Use drag-and-drop method to use the algorithm in the canvas. Click the algorithm to view and select different properties for analysis. Refer to Properties of ...Working with Widgets
You can create different visualizations using the different types of widgets provided by RubiSight. When the same data is represented in different ways, it can give different insights and help the decision-making process. The following sections ...Creating Charts using Widgets
To create a chart using widgets, follow the steps given below. Open the Dashboard in edit mode. Refer to Editing a Dashboard. The Dashboard is displayed. In the WIDGETS pane, click the widget you want to use. Note: Hover over any widget to see its ...Creating Visualization using Widgets on Dashboard
You can create different visualizations using the different types of widgets provided by RubiSight. When the same data is represented in different ways, it can give different insights and help the decision-making process. The following sections ...