Tooltip
The Tooltip is a little box that pops up when you hover over the widget. It is always attached to something, like a bar on a bar chart or a dot on a line chart. Tooltip provides us the contextual information and additional important information on a visual.
To access the tooltip option in Rubiscape, select Widget > Format > Chart > Tooltip.
The default setting for tooltip formatting varies depending on the chart. Use the toggle button to enable ( ) or disable (
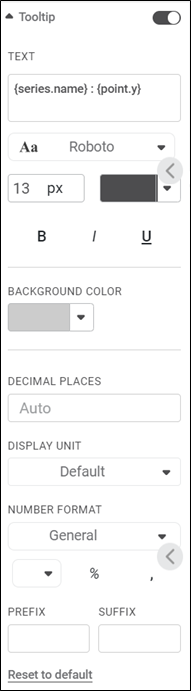 The table given below describes different fields present in Tooltip formatting.
Field | Description | Remark |
|---|---|---|
Text | It allows you to type the text that is used as the tooltip. |
|
Background Color | It allows you to select a suitable color for the background of the tooltip. | — |
Decimal Places | It allows you to select the number of decimal places up to which you want any variable value to be displayed. | By default, the calculated value is displayed in the tooltip. This value can be up to any number of decimal places. |
Display Unit | It allows you to select the multiples of units in which the variable is measured. | You can select any of the following units:
|
Number Format | Number Formatting allows you to change the way numerical entities appear on the tooltip. It is applicable for features under Measures (numerical variables). | For more information, refer to Number Format. |
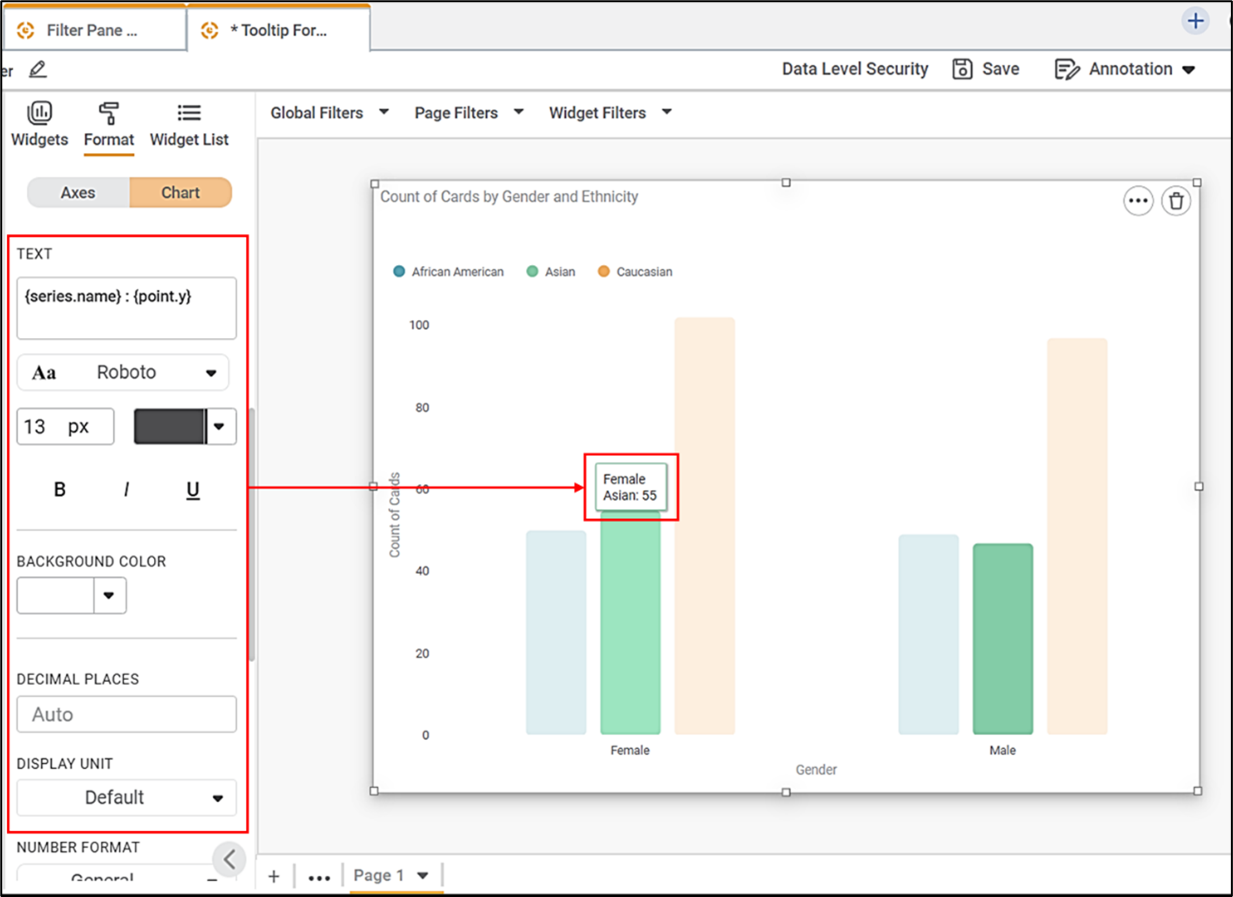
To use Tooltip formatting options, first plot a chart using the dimensions and measures from the dataset. For example, we plot a Column Chart of the Count of Cards against Gender. The Ethnicity of the sample is the Legend dimension.
The figure given below shows an original image of the Column Chart.
Now, here we
- Change the tooltip font type, font size, and font color
- Make the text bold, italic, and underlined
- Change the background color
- Change the 'Display Unit' and 'Number Format' options
The resultant widget is shown below. 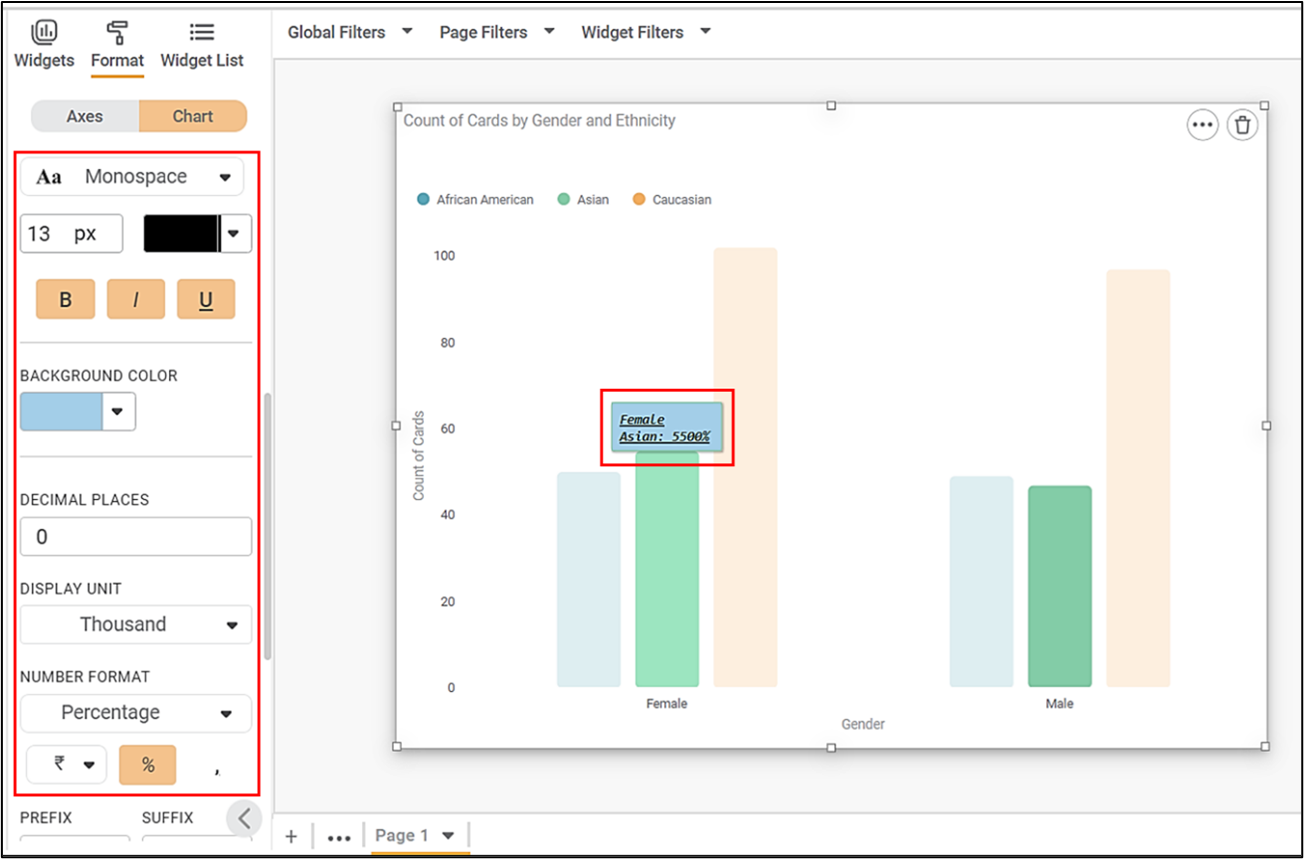
Notes |
|
Related Articles
Contextual Data Tooltips
Tooltip configuration allows you to display additional information from the source dataset that is not directly plotted on the chart. This enhances data visibility by providing contextual insights when users hover over chart elements. Overview ...Users
You can view your Tenant's users, groups, and roles in the User space. The four clickable KPI Cards for Live User Sessions, Users, Groups, and Roles take you to the respective tabs on the User Page. You can see a User Sessions chart on each of the ...Configuring Display Unit Mapping
Display Unit Mapping-Formatter To display chart labels/tooltip values/axis labels and such applicable values wherein the display unit is displayed, the formatter -Display Unit Mapping is available in the page level Format pane options. (To Navigate: ...Percentage Calculations
For widgets like pie charts and donut charts, it is sometimes required to display the values as a percentage of the share of each section in the total share. For this, Rubiscape provides a Percentage functionality alongside the Aggregation methods to ...Comma Format Options in Number Formatting
Overview Comma Format options allow users to display numbers based on region-specific digit grouping and separators. These options are available under the Comma Format dropdown and are enabled only when comma formatting is turned ON. Supported across ...