Train Test Split
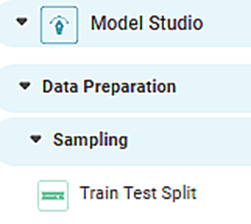
Train Test Split is located under Model Studio ( ) under Sampling in Data Preparation, in the left task pane . Use the drag-and-drop method to use the algorithm in the canvas. Click the algorithm to view and select different properties for analysis.
Refer to Properties of Train Test Split.
The train-test split is a technique to evaluate the accuracy of a model. It is used to make predictions on a large dataset. It is appropriate where a good quick estimate of the model performance is required.
In this technique, the input dataset is divided into two datasets, train and test. The train dataset is used to fit the model by getting the model trained on the input dataset. The expected output of the data is known. The test dataset is used to make predictions on unknown data. It evaluates the performance of the model on new data.
The train-test split is used when sufficiently large data is available. The data in each of the train and test sets should ideally represent the problem. There should be enough records to cover all common and uncommon cases of the problem or situation. If the dataset size is not optimum, it may overfit or underfit the model.
Properties of Train-Test Split
The table given below describes the different fields present on the properties of Train-Test Split.
Field | Description | Remark |
|---|---|---|
| Run | It allows you to run the node. | - |
| Explore | It allows you to explore the successfully executed node. | - |
| Vertical Ellipses | The available options are
| - |
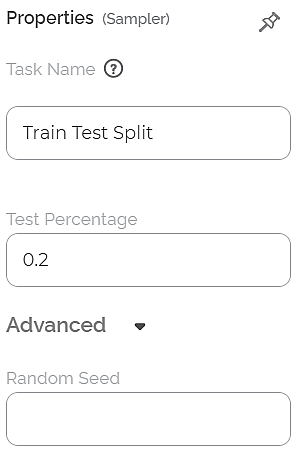
Task Name | It is the name of the task selected on the workbook canvas. | You can click the text field to edit or modify the name of the task as required. |
Test Percentage | It is the percentage to divide input data into test data. The remaining percentage is train data. | The default value is 0.2. It indicates that the dataset is split into 20% test data and the remaining 80% as train data. |
Random Seed | It is the value that builds a pattern in random data. This helps ensure that the data is split in the same pattern every time the code is rerun. | — |
Example of Train-Test Split
Consider a flower dataset with 150 records. A snippet of input data is shown in the figure given below.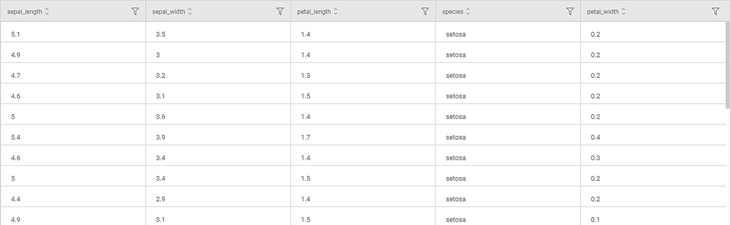
We apply Train Test Split on the input data. The input dataset is split into train records and test records randomly based on the Test Percentage parameter given in the properties.
The segmentation of records into train and test is displayed in the data column trainTestTagIntern, as shown in the figure below.
Further, we apply the Classification model Adaboost on the split data.
The result for Train data is displayed in the figure given below.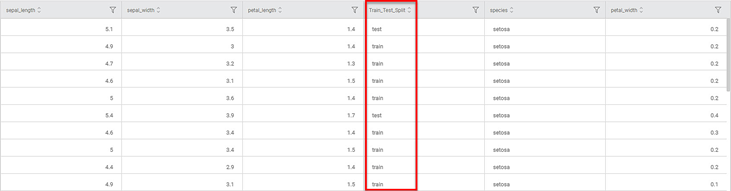
As shown in the figure above, the Adaboost model's accuracy for the Train data is 0.9417.
The result of the Test data for the Adaboost model is displayed in the figure given below.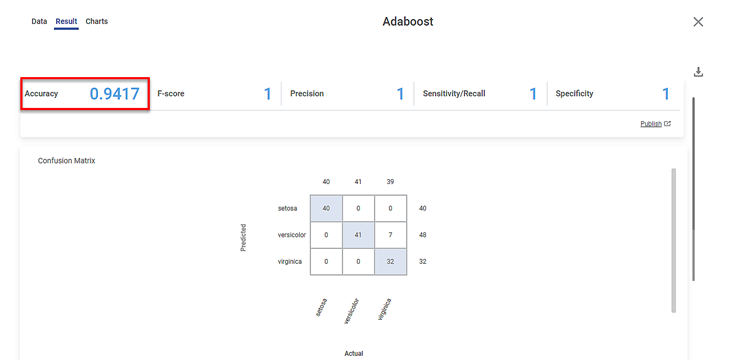
As shown in the figure above, the accuracy of the Test data is 0.8667.
Related Articles
Train Test Split
Train Test Split is located under Model Studio ( ) under Sampling in Data Preparation, in the left task pane . Use the drag-and-drop method to use the algorithm in the canvas. Click the algorithm to view and select different properties for analysis. ...Train Test Split
Train Test Split is located under Forecasting ( ) in Data Preparation, in the left task pane. Use the drag-and-drop method to use the algorithm in the canvas. Click the algorithm to view and select different properties for analysis. Refer to ...X-Split
The X-split formatting option allows you to split a single widget horizontally into multiple widgets based on the selected dimension. Notes: This option is available for all widgets except for Table, Cross Table, Text, HTML, Image, and Sparkline. The ...Y-split
The Y-split formatting option allows you to split a single widget vertically into multiple widgets based on the selected dimension. Notes: This option is available for all widgets except for Table, Cross Table, Text, HTML, Image, and Sparkline. The ...Two Sample Z Test
Two Sample Z Test Description Two sample Z test is a statistical test used to determine whether there is a significant difference between the means of two independent variables. Why to use To compare the means of two independent variables When to use ...