Train Test Split
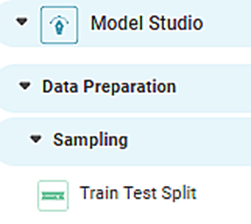
Train Test Split is located under Forecasting (  ) in Data Preparation, in the left task pane. Use the drag-and-drop method to use the algorithm in the canvas. Click the algorithm to view and select different properties for analysis.
Refer to Properties of Train-Test Split.
Properties of Train-Test Split
The available properties of Train Test Split are as shown in the figure below.
The table below describes the different fields present on the properties of Train-Test Split.
Field | Description | Remark | |
| Run | It allows you to run the node. | - | |
| Explore | It allows you to explore the successfully executed node. | - | |
| Vertical Ellipses | The available options are
| - | |
Task Name | It is the name of the task selected on the workbook canvas. | You can click the text field to edit or modify the name of the task as required. | |
Test Percentage / Number of Rows | It is the percentage / Number of rows to divide input data into test data. The remaining percentage is train data. | 2 options are available
| |
Group by | It allows you group the values by a column |
| |
Advanced | Node Configuration | It allows you to select the instance of the AWS server to provide control on the execution of a task in a workbook or workflow. | For more details, refer to Worker Node Configuration. |
Example of Train-Test Split
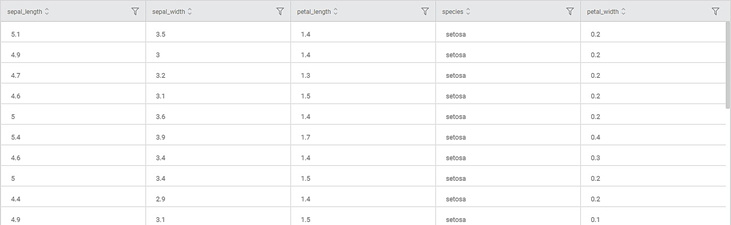
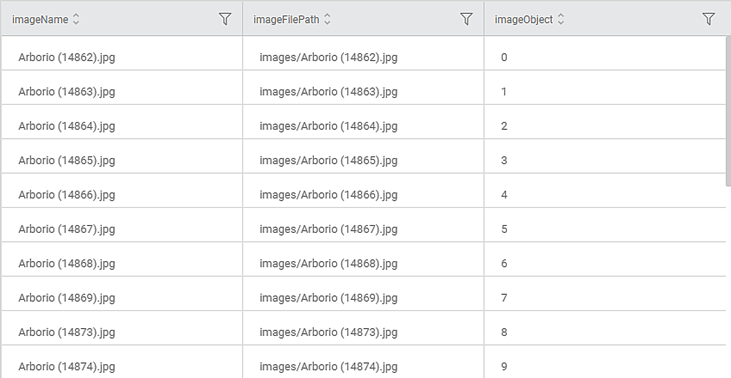
Consider an Superstore dataset with 63 records. It contains more than 10 columns. A snippet of the input data is shown in the figure given below.
We apply Train Test Split on the input data. The input dataset is split into train records and test records while maintaining the data sequence, based on the Test Percentage parameter given in the properties.
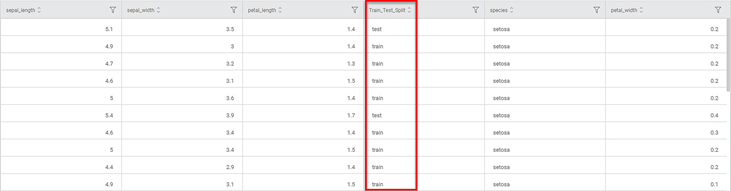
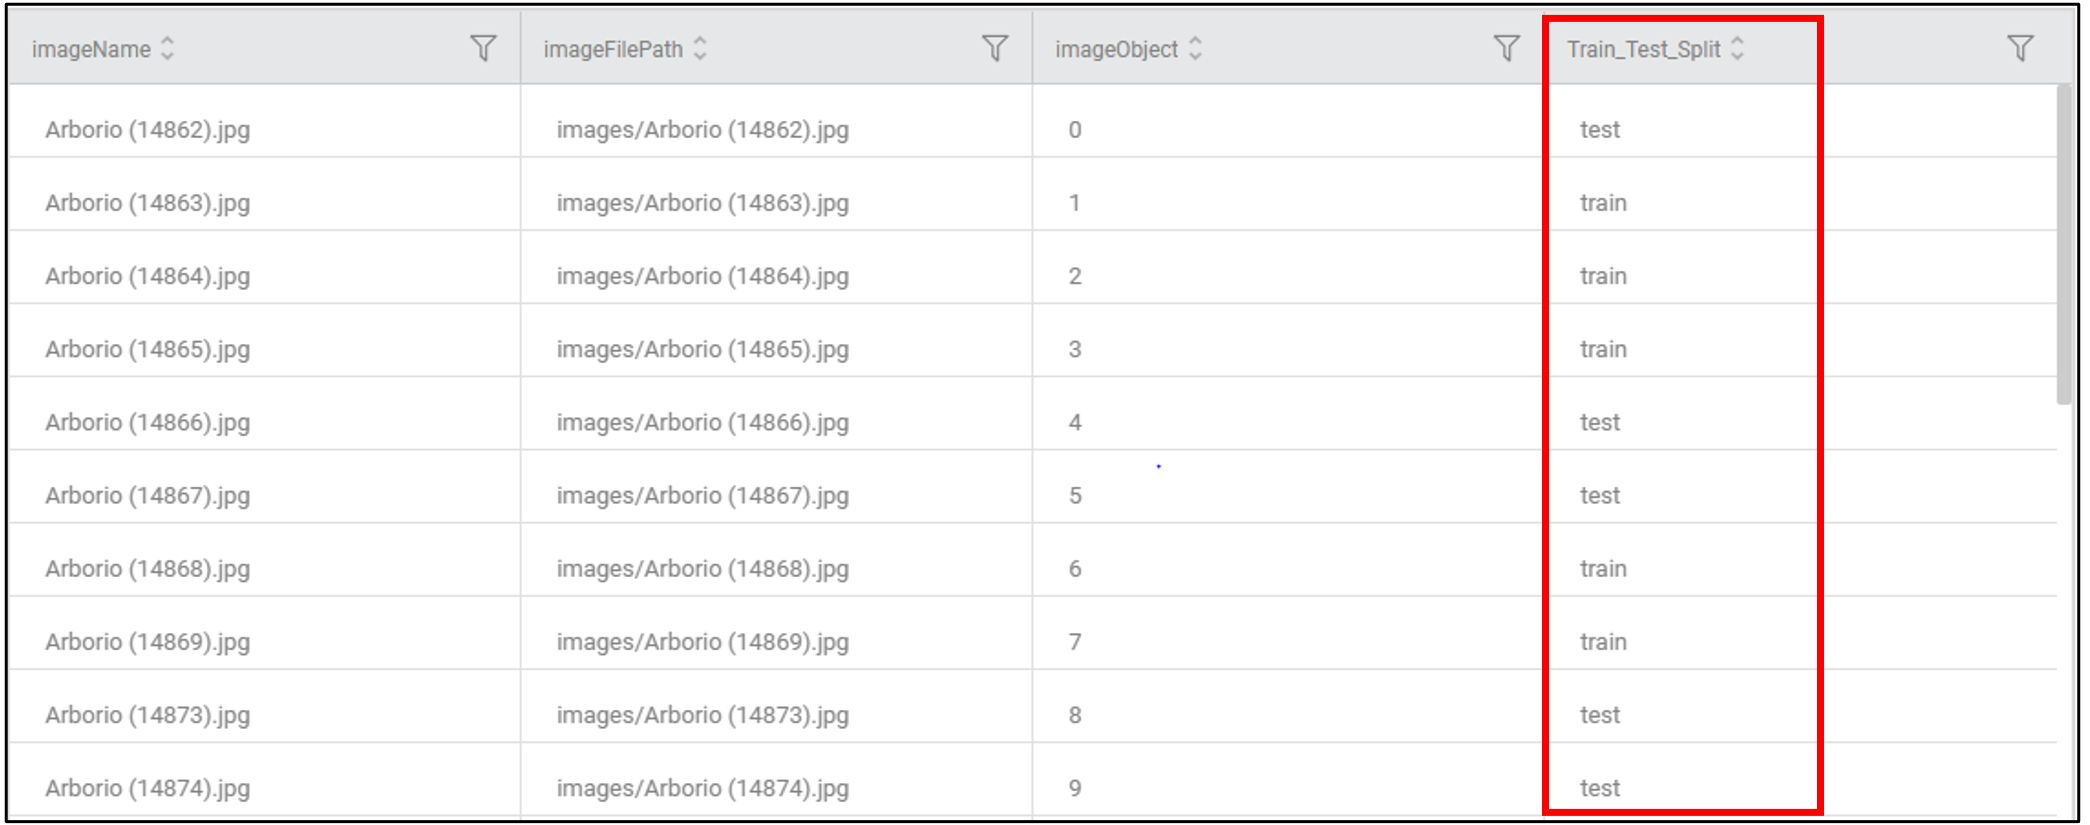
The segmentation of records into Train and test is displayed in the data column Train Test Split, as shown in the figure below.
If you scroll down the data, you notice that the train and test records are segregated to maintain the seasonality of the data.
Further, we apply the time-series forecasting algorithm ARIMA (Auto-Regressive Integrated Moving Average) on the split data.
The result for Train data is displayed in the figure given below. The graph shows the variation in the sales with Ship date.
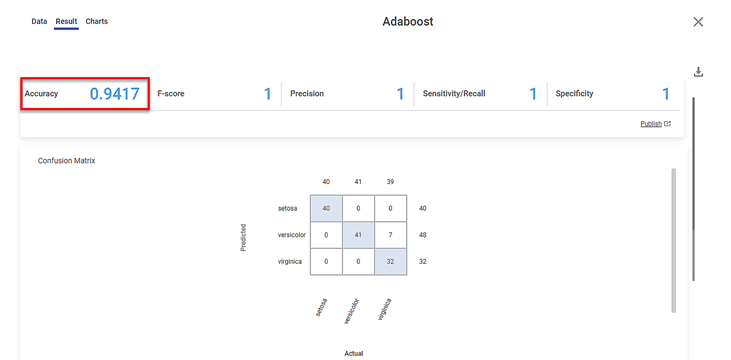
The Result page also displays the Trained Model Parameters for the ARIMA algorithm, and its Accuracy, on the same page, below the graph.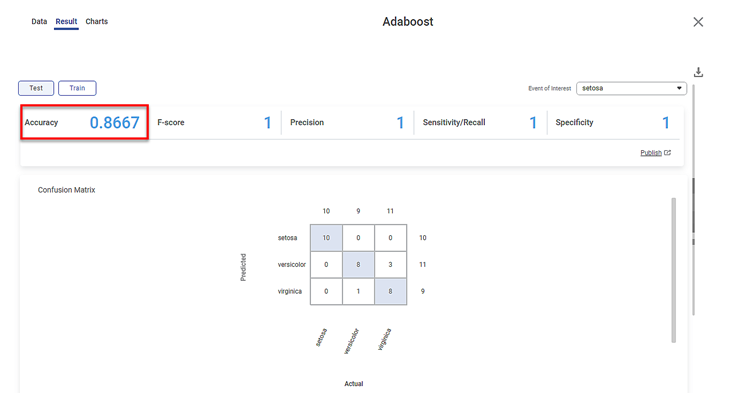
Similarly, the resulting graph for the Test data for ARIMA is displayed in the figure given below.
Also, the Result page displays the Trained Model Parameters for the ARIMA algorithm and its Accuracy corresponding to Test Data, on the same page, below the graph.
Similarly, you can use Train Test split to test the performance of other Forecasting algorithms.
Related Articles
Train Test Split
Train Test Split is located under Model Studio () under Sampling in Data Preparation, in the left task pane . Use the drag-and-drop method to use the algorithm in the canvas. Click the algorithm to view and select different properties for analysis. ...Train Test Split
Train Test Split is located under Model Studio ( ) under Sampling in Data Preparation, in the left task pane . Use the drag-and-drop method to use the algorithm in the canvas. Click the algorithm to view and select different properties for analysis. ...X-Split
The X-split formatting option allows you to split a single widget horizontally into multiple widgets based on the selected dimension. Notes: This option is available for all widgets except for Table, Cross Table, Text, HTML, Image, and Sparkline. The ...Y-split
The Y-split formatting option allows you to split a single widget vertically into multiple widgets based on the selected dimension. Notes: This option is available for all widgets except for Table, Cross Table, Text, HTML, Image, and Sparkline. The ...Two Sample Z Test
Two Sample Z Test Description Two sample Z test is a statistical test used to determine whether there is a significant difference between the means of two independent variables. Why to use To compare the means of two independent variables When to use ...