Two Way ANOVA
Two Way ANOVA is located under Model Studio ( ) in ANOVA Analysis under Statistical Analysis, in the task pane on the left. Use the drag-and-drop method to use the algorithm in the canvas. Click the algorithm to view and select different properties for analysis. Refer to Properties of Two Way ANOVA.
Properties of Two-Way ANOVA
The available properties of the Two Way ANOVA are as shown in the figure given below.
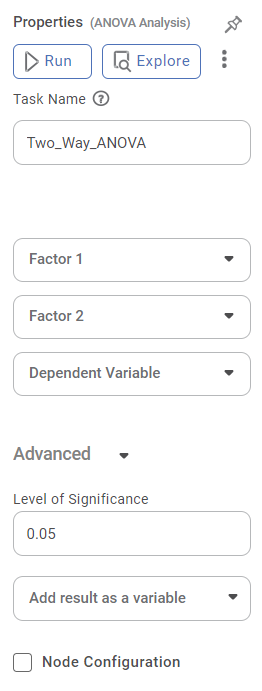
The table given below describes the different fields present on the properties of Two Way ANOVA.
Field | Description | Remark |
| Run | It allows you to run the node. | - |
| Explore | It allows you to explore the successfully executed node. | - |
| Vertical Ellipses | The available options are
| - |
Task Name | It is the name of the task selected on the workbook canvas. | You can click the text field to edit or modify the name of the task as required. |
Factor 1 | It allows you to select the independent variables with numerical values. | Multiple data fields can be selected. |
Factor 2 | It allows you to select the categorical independent variables. | Multiple data fields can be selected. |
Interpretation of Result of Two-Way ANOVA
The table given below describes the parameters of One-Way ANOVA Test Results.
Parameter | Description | Remark |
Degrees of Freedom | The number of independent values that can differ freely within the constraints imposed on them. | — |
Sum of Squares | It is the sum of the square of the variations. Variation is the difference (or spread) of each value from the mean. | — |
Mean Sum of Squares | It is the value obtained by diving the Sum of Squares by Degrees of Freedom. | — |
F-Ratio | It is the ratio of two Mean Square values. | If the null hypothesis is true, the value of the F-ratio is closer to 1.0 |
p Value | It is the probability of obtaining the observed results, or more extreme, of a hypothesis test, assuming that the study question's null hypothesis is true. | If the p value < 0.05, we reject the null hypothesis. |
W Stats | It tests whether a random sample comes from a normal distribution. Shapiro Wilk Test and Bartlett Test both generate this value. | If the W Stats value is small, the null hypothesis is rejected, and you can conclude that the random sample is not normally distributed. |
Shapiro Wilk Test | Null Hypothesis – The collected samples are from a normally distributed population. Alternative Hypothesis – The collected samples are from a population that is not normally distributed. | If p value < 0.05, we reject the null hypothesis. If p value > 0.05, we do not reject the null hypothesis. |
Bartlett Test | Null Hypothesis – All the samples have the same variance. (They have homogeneity in variance.) Alternative Hypothesis – All the samples do not have the same variance. | If p value < 0.05, we reject the null hypothesis. If p value > 0.05, we do not reject the null hypothesis. |
Example of Two-Way ANOVA
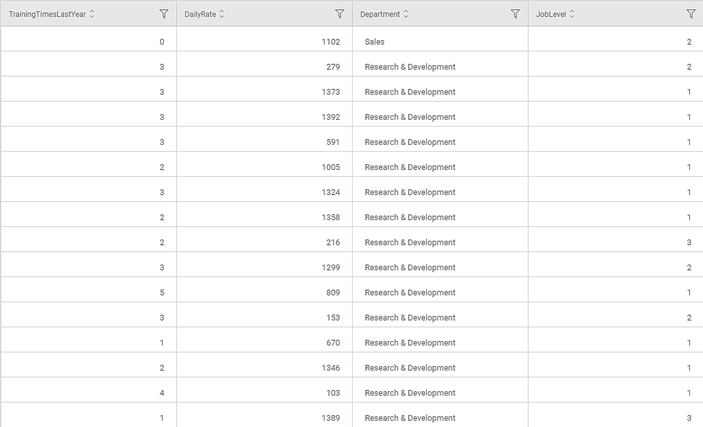
Consider an example of HR dataset. A data snippet for average yield of seeds in first three quarters over the past few years is shown in the figure below.
We use Two-Way ANOVA on the above data. The result is displayed in the figure given below
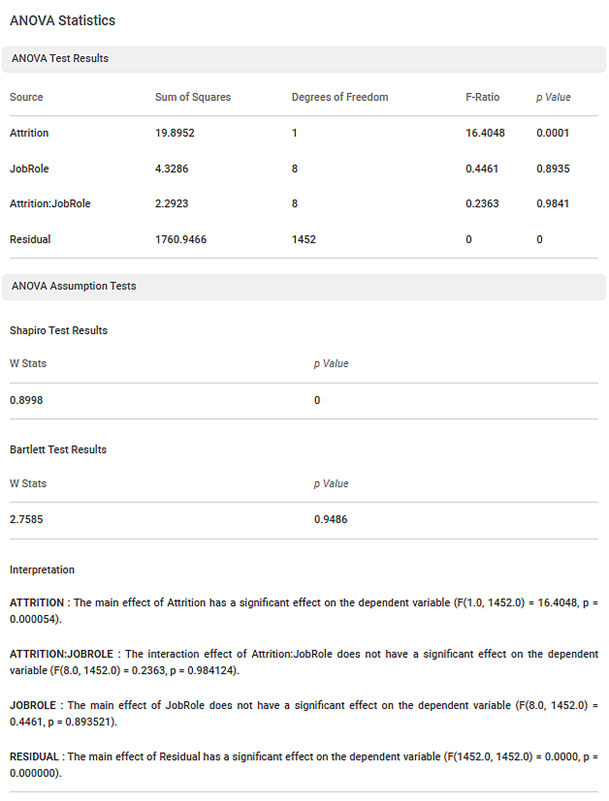
In the above figure,
- The p-value for ANOVA Analysis is 0.0001
- The p-value for Shapiro Wilk Test is 0
- The p-value for the Bartlett test is 0.9486
Since the p-value of ANOVA is 0.0001 which is significant (< 0.05), implies the variable (time in years) has significant impact on the yield. The p-value of Shapiro Test is 0 which is significant (< 0.05), we conclude that the data is not normally distributed. The p-value of Bartlett test is 0.9486 which is not significant (> 0.05), we conclude that there is homogeneity of variance in the data.
Related Articles
One Way ANOVA
One Way ANOVA is located under Model Studio ( ) in ANOVA Analysis under Statistical Analysis, in the task pane on the left. Use the drag-and-drop method to use the algorithm in the canvas. Click the algorithm to view and select different properties ...Two Sample Z Test
Two Sample Z Test Description Two sample Z test is a statistical test used to determine whether there is a significant difference between the means of two independent variables. Why to use To compare the means of two independent variables When to use ...Number Format
Number Formatting allows you to change the way numerical entities appear on the X and Y-axes. It is applicable for features under Measures (numerical variables). The figure below shows the available Number Format options. The table given below ...Using Parameters in RubiSight
In RubiSight, two types of user-defined values are available, Calculated Column Parameters A Calculated Column is created as a new column created that was not a part of the original dataset. The new column is related to one (or more) of the existing ...Restrict to Single User Dashboard Access in Edit Mode
Overview: This functionality ensures that only one user can open and work in the Edit Mode of a dashboard at any given time. While design access is restricted to a single user, multiple users can simultaneously view the same dashboard in View Mode ...