Using a Parameter
You can use the created parameter in any of the widgets on the dashboard. You can change the values in the selected Calculated Column based on the value of the selected Parameter.
Using a Numerical Parameter
To use a created Numerical Parameter, follow the steps given below.
Plot a widget of your choice. Refer to Creating charts using Widgets.
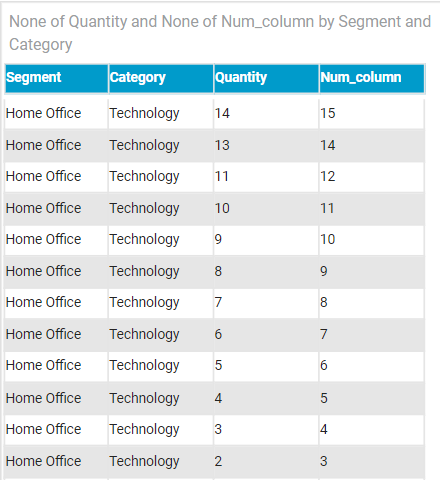
In the example, we plot a Table widget. We use Quantity (None), Num_Column (None), Category, and Segment as the Configuration parameters.In the example, Num-Column (None) is the Calculated Column.Note
- When you plot a widget, make sure to use the Calculated Column as one of the parameters.
- To apply the created Parameter, create the Parameter widget. Refer to Creating charts using widgets.
In the example, we use the Num_Parameter as the Parameter of type Numerical. The Parameter widget displays the Display Type value as one (1) since it was the default value selected while creating the Parameter.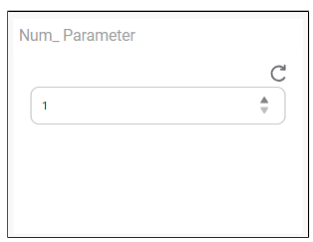
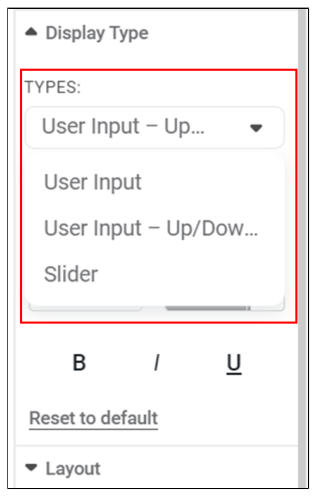
To change the value in the Display Type field, you have three options available, Click the down arrow next to User Input to view and select the options from the drop-down list.
The table below describes how the Numerical Parameter value can be changed.Field Description Remark User Unput It allows you to enter a value manually in the Display Type field. - It is the Current value in the field.
- When the Parameter widget is plotted, the Display Type field displays the Current value selected while creating the Parameter.
User Input – Up/Down Arrow It allows you to operate the upward/downward arrows to increase/decrease the value in the Display Type field at a pre-decided increment frequency. The pair of arrows appear in the Display Type field on the right. Slider It allows you to operate the upward/downward arrows to increase/decrease the value in the Display Type field at a pre-decided increment frequency. When this option is selected from the drop-down, a slider is displayed in the Parameter widget.
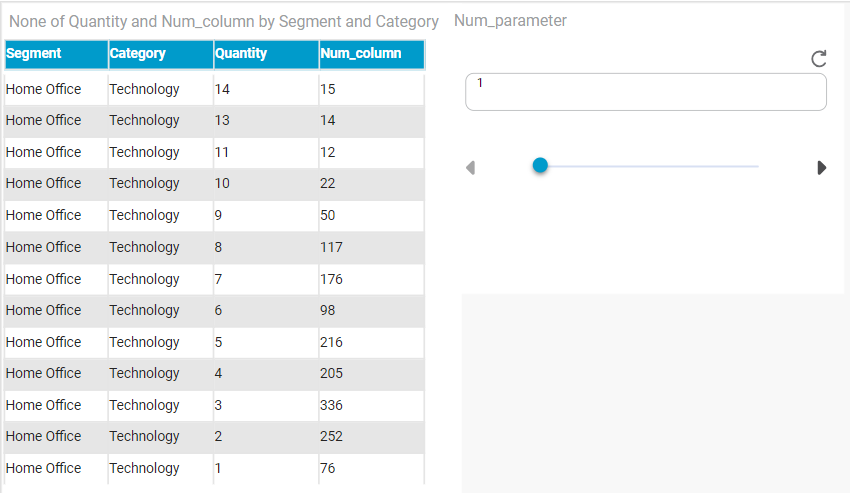
- To apply the parameter on the selected column, change the value in the Display Type field. In the example, we use the slider and change the value from 1 to 6.
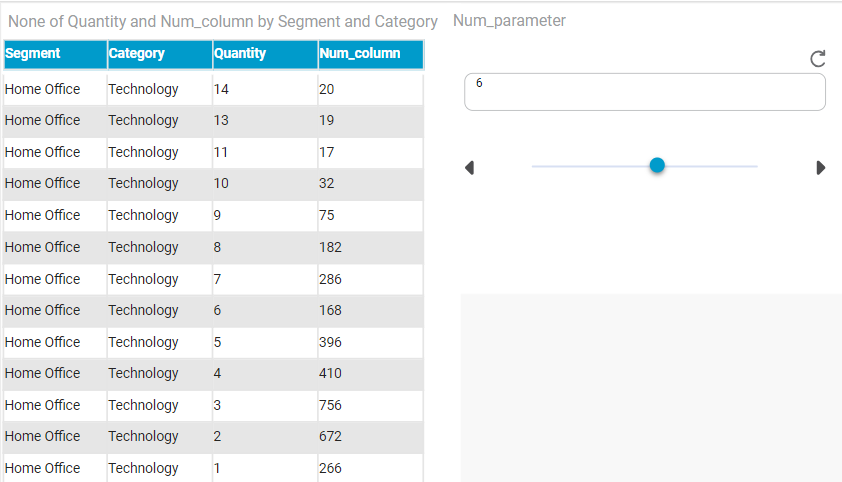
The corresponding values in the Num Column increase by Six. Since the Current value of the Num_Parameter is incremented by Six, each value in the Num_Column is incremented by Six.
Using a Categorical Parameter
To use a created Categorical Parameter, follow the steps given below.
- Plot a widget of your choice. Refer to Creating charts using Widgets.
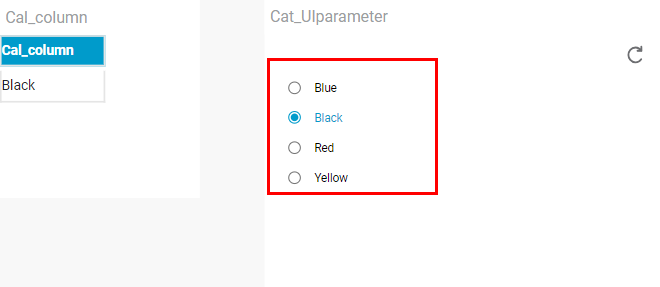
In the example, we plot a Table widget using the Categorical Parameter Cat_Column as the Configuration parameter.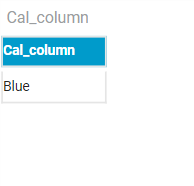
To apply the created Parameter, create the Parameter widget. Refer to Creating charts using Widgets.
This widget has only one parameter, which is the Cat_UIParameter.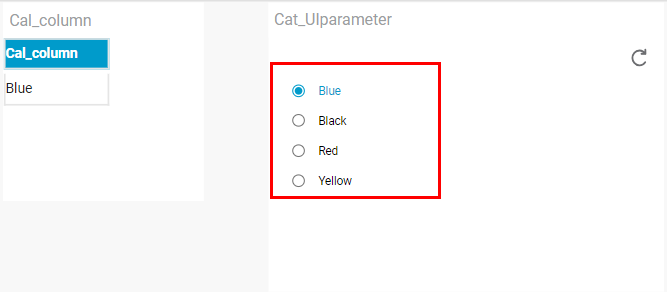
The Parameter widget displays the Display Type value as Black since it was the Current value selected while creating the Parameter.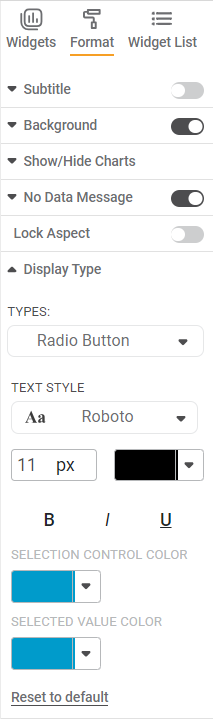
There are seven options available to change the value in the Display Type field. You can click the down arrow next to the User Input to view and select the options from the drop-down list.
The table below describes how the Categorical Parameter value can be changed.Field
Description
Remark
User Input
It allows you to enter a value manually in the Display Type field.
- It is the Current value in the field.
- When the Parameter widget is plotted, the Display Type field displays the Current value selected while creating the Parameter.
User Input – Up/Down Arrow
It allows you to operate the upward/downward arrows to increase/decrease the value in the Display Type field at a pre-decided increment frequency.
The pair of arrows appear in the Display Type field on the right.
Slider
It allows you to operate the slider dot or a pair of arrows on the two ends of the slider to change the value in the Display Type field.
When this option is selected from the drop-down, a slider is displayed in the Parameter widget.
Single Value Drop Down
When selected, it creates a drop-down list from which you can select a value.
Only one value can be selected.
Radio Button
When selected, it creates a list of parameter values with a radio button assigned to each value.
Only one value can be selected.
Button
When selected, it creates list of parameter values with a button assigned for every value.
Only one value can be selected.
Toggle Button
When selected, it creates list of parameter values with a toggle button assigned for every value.
Only one value can be selected
- To apply the parameter on the selected column, change the value in the Display Type field. In the example, we use the Radio Button and change the value from Black to Blue. There is a corresponding change in the Calculated column in the Table widget.
Using an Interval Parameter
To use a created Interval Parameter, follow the steps given below.
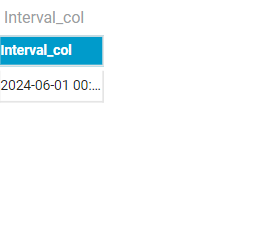
- Plot a widget of your choice. Refer to Creating charts using Widgets. In the example, we plot a Table widget using the Interval Parameter Int_Column as the Configuration parameter.
To apply the Parameter, create the Parameter widget. Refer to Creating charts using Widgets.
This widget has only one parameter, which is the Int_Parameter.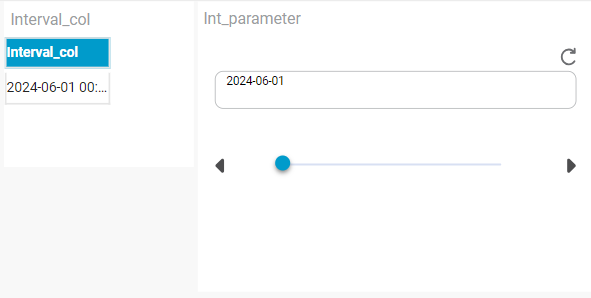
The Parameter widget displays the Display Type value as 2024-06-01 since it was the Current value selected while creating the Parameter.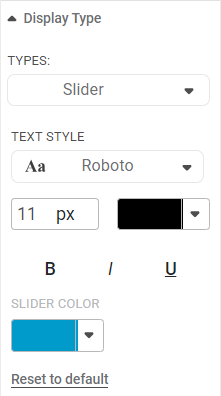
There are two options available to change the value in the Display Type field. You can click the down arrow next to the User Input to view and select the options from the drop-down list.
The table below describes how the Interval Parameter value can be changed.Field
Description
Remark
User Input
It allows you to enter a value manually in the Display Type field.
- It is the Current value in the field.
- When the Parameter widget is plotted, the Display Type field displays the Current value selected while creating the Parameter.
Slider
It allows you to operate the slider dot or a pair of arrows on the two ends of the slider to change the value in the Display Type field.
When this option is selected from the drop-down, a slider is displayed in the Parameter widget.
To apply the parameter on the selected column, change the value in the Display Type field. In the example, we use the slider and change the value from 2023-04-18 to 2023-04-15.
You will notice a corresponding change in the Calculated column in the Table widget.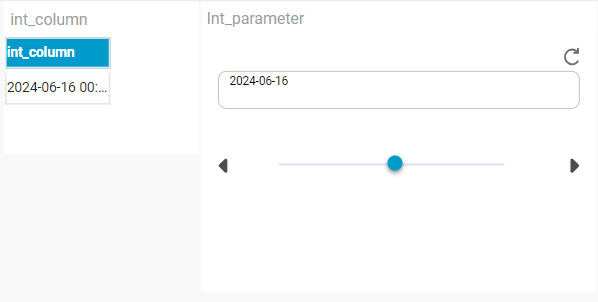
Using a Boolean Parameter
To use a created Boolean Parameter, follow the steps given below.
- Plot a widget of your choice. Refer to Creating charts using Widgets.
In the example, we plot a Table widget. We use the Boolean Parameter Bool_Column as the Configuration parameter.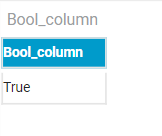
To apply the Parameter, create the Parameter widget. Refer to Creating charts using Widgets.
This widget has only one parameter, which is the Bool_Parameter.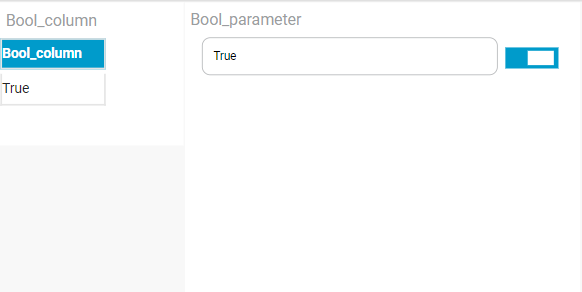
The Parameter widget displays the Display Type value as True since it was the Current value selected while creating the Parameter.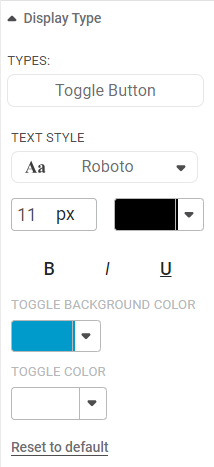
There are two options available to change the value in the Display Type field. You can click the down arrow next to the User Input to view and select the options from the drop-down list.
The table below describes how the Boolean Parameter value can be changed.Field
Description
Remark
User Input
It allows you to enter a value manually in the Display Type field.
- It is the Current value in the field.
- When the Parameter widget is plotted, the Display Type field displays the Current value selected while creating the Parameter.
Toggle Button
It allows you to operate the toggle button
to change the value.To apply the parameter on the selected column, change the value in the Display Type field.
In the example, we use the Toggle Button and change the value from True to False.
You will notice a corresponding change in the Calculated column in the Table widget.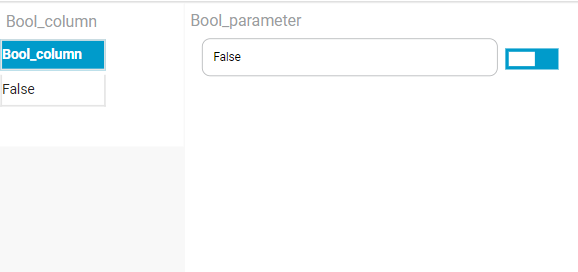
Notes
- If there is more than one widget on a Dashboard page, the selected Parameter can be applied to only those widgets plotted using the Calculated Column.
- Those widgets which do not contain the Calculated Column remain unaffected even after altering the Parameter value from the Parameter widget.
Related Articles
Modifying a Parameter
While using a Parameter, it is sometimes observed that the values selected while creating the Parameter are not selected correctly or need to be changed. In that case, we can use the Modify option to make the necessary changes to the Parameter. To ...Adding a Parameter
Before using a Parameter, we add and create the Parameter in the Dashboard. In the RubiSight DATA pane, a Parameter is present as an independent entity. To add a Parameter in a Dashboard, follow the steps given below. Open the Dashboard in edit mode. ...Using Parameters in RubiSight
In RubiSight, two types of user-defined values are available, Calculated Column Parameters A Calculated Column is created as a new column created that was not a part of the original dataset. The new column is related to one (or more) of the existing ...Using While Condition
To use the While condition, follow the steps given below. Open the required workbook or create a new workbook. The selected workbook canvas is displayed. Add the reader/dataset if not already present in your workbook. Drag-and-drop or double-click ...Using While Condition
To use the While condition, follow the steps given below. Open the required workbook or create a new workbook. The selected workbook canvas is displayed. Add the reader/dataset, if not already present in your workbook. Drag-and-drop or double-click ...