Count Vectorizer
CountVectorizer is located under Textual Analysis (  ) in Text Vectorization, in the task pane on the left. Use the drag-and-drop method (or double-click on the node) to use the algorithm on the canvas. Click the algorithm to view and select different properties for analysis.
Refer to Properties of CountVectorizer.
Properties of CountVectorizer
The available properties of CountVectorizer are as shown in the figure given below.
The table given below describes the different fields present on the Properties pane of CountVectorizer.
Field | Description | Remark | |
|---|---|---|---|
| Run | It allows you to run the node. | - | |
| Explore | It allows you to explore the successfully executed node. | - | |
| Vertical Ellipses | The available options are
| - | |
Task Name | It displays the name of the selected task. | You can click the text field to edit or modify the name of the task as required. | |
Text | It allows you to select the text variable for which you need to perform the task. |
| |
Advanced | Lowercase | It converts the features to lowercase if selected as True. | The default value is True. |
Ngram Minimum Range | It determines the minimum probability of occurrence of each feature in a sequence of N words, where N = 1, 2, 3, and so on. |
| |
Ngram Maximum Range | It determines the maximum probability of occurrence of each feature in a sequence of N words where N = 1, 2, 3, and so on. |
| |
Stop Words | It allows you to add one or multiple stop words from the standard English set of stop words. |
| |
Example of CountVectorizer
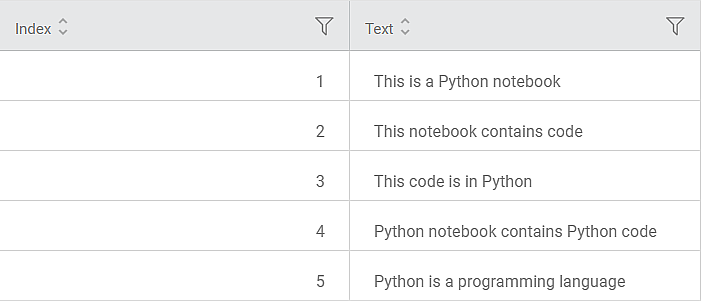
Consider a dataset with one of the variables as a text variable. A snippet of the input data is shown in the figure given below.
In the Properties pane, the values are selected as shown in the table below.
Text | Text |
Lowercase | True |
Ngram Minimum Range | 1 |
Ngram Maximum Range | 1 |
Stop Words | None |
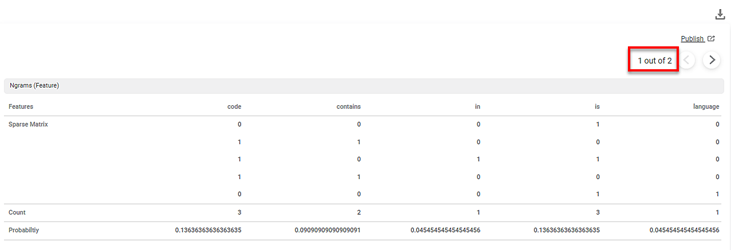
The first part of the Result of CountVectorizer is shown in the figure below.
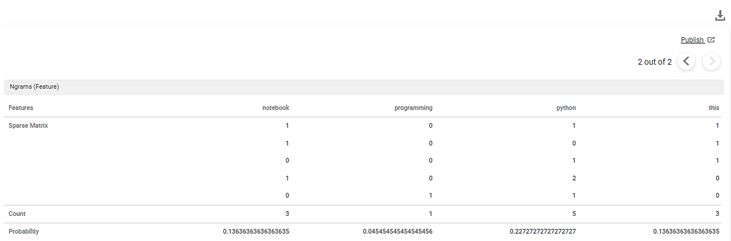
The second part of the Result of CountVectorizer is shown in the figure below.
The Result page displays the Sparse Matrix for the selected text variable.
A Sparse matrix is a structure that contains as many rows as the data points and as many columns as the number of features. In the matrix,
- Each Features column represents one feature in the dictionary.
- Each Count column represents the count of the occurrence of each feature in the dictionary.
- Each Probability column represents the probability of occurrence of each feature in a sequence of N words.
Key Observations:
- The dictionary (content_Original) contains 9 features.
- Each text is a row in the sparse matrix. Thus, the sparse matrix has 9 rows.
- Each cell in a row contains a number which is the count of the feature in that text.
- The Result page displays five features on each page. Here, the total number of features are 9. In our example, the nine features are code, contains, in, is, language, notebook, programming, python, and this.
- The features in the columns are arranged alphabetically.
- To navigate to the next five features, you can click on the next arrow (
 ) icon.
 - Each feature is converted to lowercase since the value selected in the Lowercase drop-down in the Properties pane is True.
In the above example, the count of the feature code is 3. Its probability is 0.13636 and is calculated according to the Ngram Minimum Range and Ngram Maximum Range values entered in the Properties pane. No word is excluded from the features columns since stop words are not defined in the Properties pane.
Notes: |
|
You can click ( ) on the CountVectorizer task node to publish the model. The model can be reused in a workbook and workflow for training and experimenting or can be used in a workflow for production. For more information on publishing a task, refer to Publishing Models.
A snippet of the text variable is shown in the figure given below.
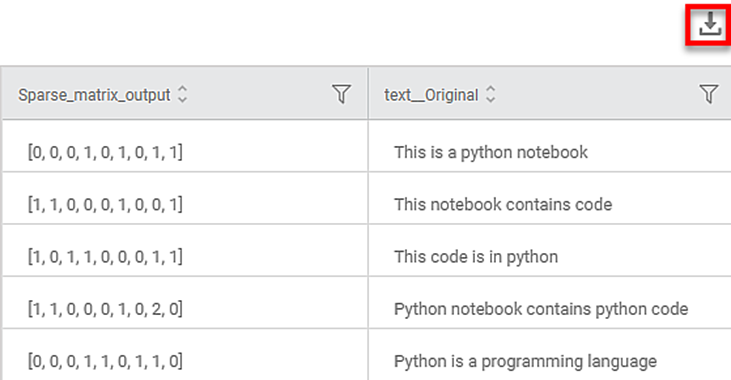
On the Data page, you can see the
- Text variable column name is displayed as <variable name>_Original along with its text in rows.
- Sparse Matrix containing the binary representation of each feature (according to the alphabetical sequence shown on the Results page) in a row.
- You can download the text data from the Data page using the download icon .
- You can hover over a row in the text variable column to view the entire text in that row.
You can see that
- The selected text variable (dictionary) contains 5 rows of text data.
- Each row represents a text in the dictionary.
- The Data page in the CountVectorizer result displays the text variable and its texts.
Related Articles
Contextual Data Tooltips
Tooltip configuration allows you to display additional information from the source dataset that is not directly plotted on the chart. This enhances data visibility by providing contextual insights when users hover over chart elements. Overview ...Duplicate Records Handling / Deduplication
Overview A new Deduplication feature node has been introduced under the Data Preparation module to identify and remove duplicate records based on full rows or selected columns. Feature Enhancements Added Deduplication option under the Data ...Workflow : Delegate, Recall, Reassign, Workflow Task Cards.
Introduction The Workflow Module in Rubiscape enables users to create workflows, design process flows using nodes, configure approval steps, assign approvers, and monitor task statuses within the same workspace. 1. Tasks Tab The Tasks tab displays ...Multiple Execution
Rubiscape provides a feature that enables the multiple execution of a complete pipeline. This allows the entire pipeline to be executed multiple times, creating a new instance for each run. Each instance can be configured independently. For multiple ...Support Aggregations for Categorical/Dimension Columns in Table
For categorical columns or Dimensions, the aggregation option is available while configuring Table chart. This option is available for getting the aggregated values with Count, Count (Distinct) values for all types of Dimension columns- dataset ...