Fixed Line
The figure given below shows the Add Fixed Line page.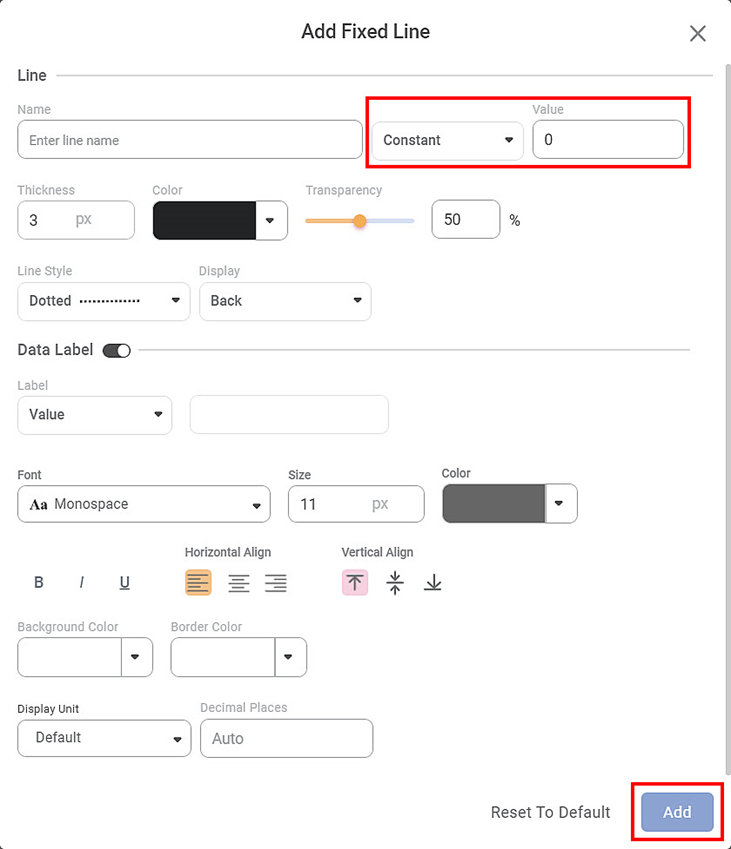
The table given below describes different fields present on Add Fixed Line page.
Section | Field | Description | Remark |
Line | Name | It allows you to select a name for the Fixed Line. | · Select a proper name that is convenient to remember. · It is a mandatory field. |
Constant | It allows you to select a constant value, corresponding to which the Fixed Line is plotted. | You need to select the value between the range of values plotted on the axis. | |
Measure | It allows you to select a Measure Aggregation corresponding to which Fixed Line is plotted. | In Measure, you can select any measure from the available dataset.
In Aggregation, you can select one of the following options as per the requirement. · Mean · Medium · Minimum · Maximum · Sum · Percentile | |
Thickness | It allows you to select the line thickness. | The minimum and maximum values for thickness are 3 and 20, respectively. | |
Color | It allows you to select the line color. | By default, the color is black. | |
Transparency | It allows you to select the line shading concentration. | · The minimum and maximum values for concentration are 0% and 100%, respectively. · The 0% value indicates the lightest shade, and 100% indicates the darkest shade for the line color. · The default Transparency for the line shading is 50%. | |
Line Style | It allows you to select the line appearance. | · You can select any one of the following three types of appearances. o Dashed o Dotted o Solid · By default, the dotted line style is applied to the reference line. | |
Display | It allows you to select the line placement. | · You can select to place the line at the o Back or o Front of the plotted widget · By default, the reference line is placed at the Back of the widget. | |
Data Label | Label | It allows you to select the content displayed along with the line. | · Select one of the following labels. o Value o Custom Text · When you select the value, it automatically appears in the field next to Label. This field is not editable. · When you select Custom Text, you can insert relevant text in the field next to Label, to be displayed with the line. · You can make the Label bold, italic, and underline it. |
Font | It allows you to select the Label font. | You can select any one of the following font types: · Monospace (default) · Raleway · Roboto · Calibri · Times New Roman · Segoe UI | |
Size | It allows you to select the Label font size. | The minimum and maximum font sizes applicable are one (1) and 1638, respectively. | |
Color | It allows you to select the Label color. | By default, the color is light black. | |
Horizontal Align | It allows you to place the Label horizontally concerning the line. | · You can align the Label horizontally at the Left, Centre, and Right of the Fixed Line. · By default, the Label is always horizontally aligned to the Left. | |
Vertical Align | It allows you to place the Label vertically concerning the line. | · You can align the Label vertically Above the Line, On the Line, and Below the Line. · By default, the Label is always vertically aligned Above the line. | |
Background Color | It allows you to select the color for the Label background. | By default, the color is white. | |
Border Color | It allows you to border the region in which the Label is displayed. | By default, the color is white. | |
Display Units | It allows you to select the multiples of units in which the Label value is measured.
| · You can select any of the following units o Default o None o Thousand o Lakhs o Millions o Billions o Trillions · Default indicates that the unit is assigned automatically by parsing the value. · None represents that no unit is set for the value. | |
Decimal Places | It allows you to select the number of decimal places up to which you want to display the Label value. | The minimum and the maximum number of decimal places allowed are one (1) and nine (9), respectively. |
|
|
To insert the Fixed Analytics line, first plot a Column Chart using the dimensions and measures from the dataset.
For example, we plot a Column Chart of Average Sales by Category.
By default, no reference line is displayed. The Line toggle is switched Off.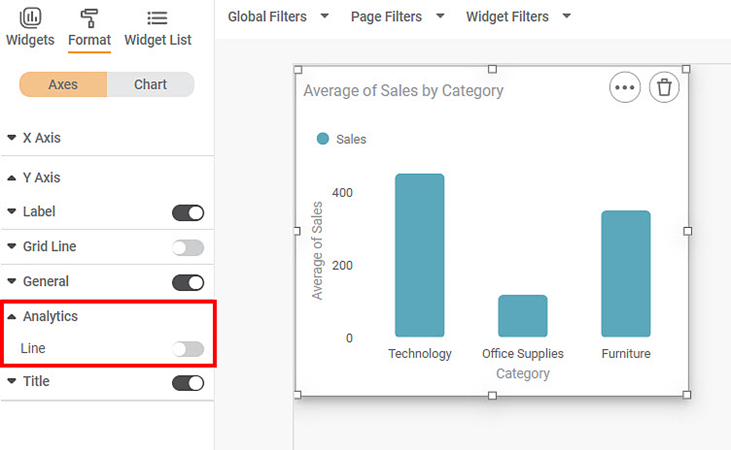
We configure the Fixed Line with constant value by changing the Line and Data Label field parameters.
A random value of 250 is selected as the Line Value for the Fixed Line. All other fields on the Fixed Line page are suitably edited.
The resultant widget is shown below.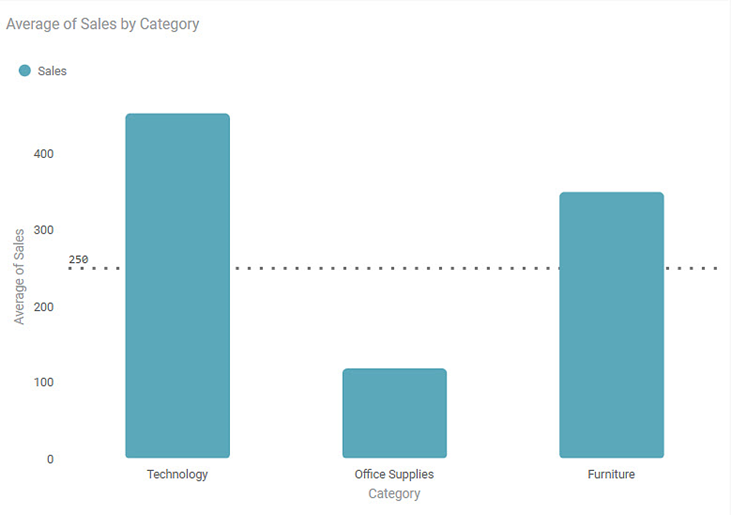
We configure the Fixed Line with Measure Aggregate by changing the Line and Data Label field parameters.
A random Sales value is selected and Mean Aggregation is selected for the Fixed Line with Measure Aggregate. All other fields on the Fixed Line page are suitably edited.
The resultant widget is shown below.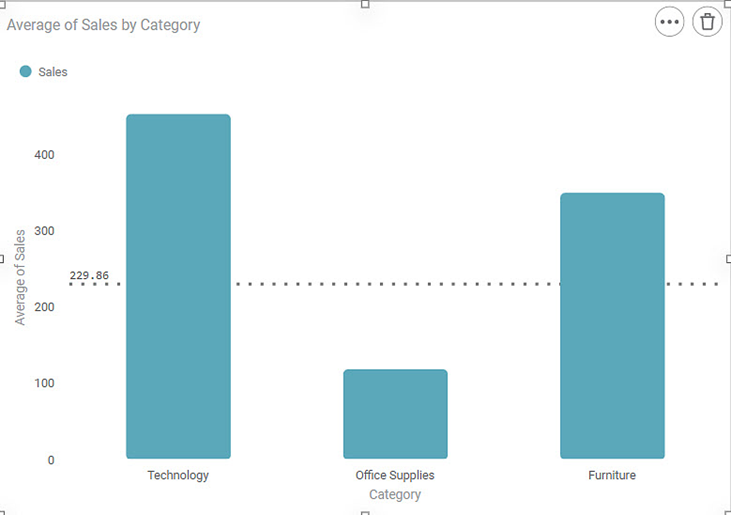
Related Articles
Aggregate Line
The figure given below shows the Add Aggregate Line page. The table given below describes different fields present on Add Aggregate Line page. Section Field Description Remark Line Name It allows you to select a name for the Aggregate Line. · Select ...Analytics ( Reference) Line
An Analytics (Reference) Line corresponds to a particular value on the X or Y axis regarding the widget plotted. Notes: An analytics line is used to draw in any widget that contains at least one of the two axes, for example, Column Chart, Pareto ...Line Style
Line Style feature allows you to customize the appearance of the lines in the widgets. It helps you to tailor the visualizations to meet your specific needs and preferences. This feature is available in the following widgets: Line, Pareto, ...Grid Line
Gridlines are a crisscross mesh of lines drawn in the region between X and Y axes in a graph or chart. The table given below describes different fields present on Grid Line formatting on Y-axis. Field Description Remark Width It allows you to select ...Grid Line
Gridlines are a crisscross mesh of lines drawn in the region between X and Y axes in a graph or chart. The table given below describes different fields present on Grid Line formatting on X-axis. Field Description Remark Width It allows you to select ...