Grid Line
Gridlines are a crisscross mesh of lines drawn in the region between X and Y axes in a graph or chart.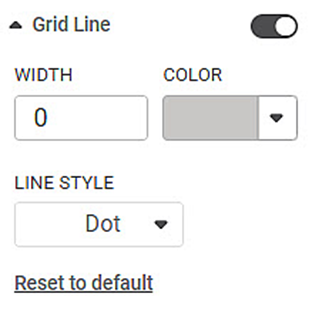
The table given below describes different fields present on Grid Line formatting on X-axis.
Field | Description | Remark |
|---|---|---|
Width | It allows you to select the width of the grid lines drawn perpendicular to the X-axis. | The default width selected is zero. |
Color | It allows you to select the color of the gridlines drawn perpendicular to the X-axis. | — |
Line Style | It allows you to select the type of line as a grid line. | You can choose from any of the following line options
|
To use Grid Line formatting options, first plot a Column Chart using the dimensions and measures from the dataset. For example, we plot a Column Chart of the Count of Cards against Gender. The Ethnicity of the sample is the Legend dimension.
The figure given below shows an original image of the Column Chart. By default, there is no gridline in the chart.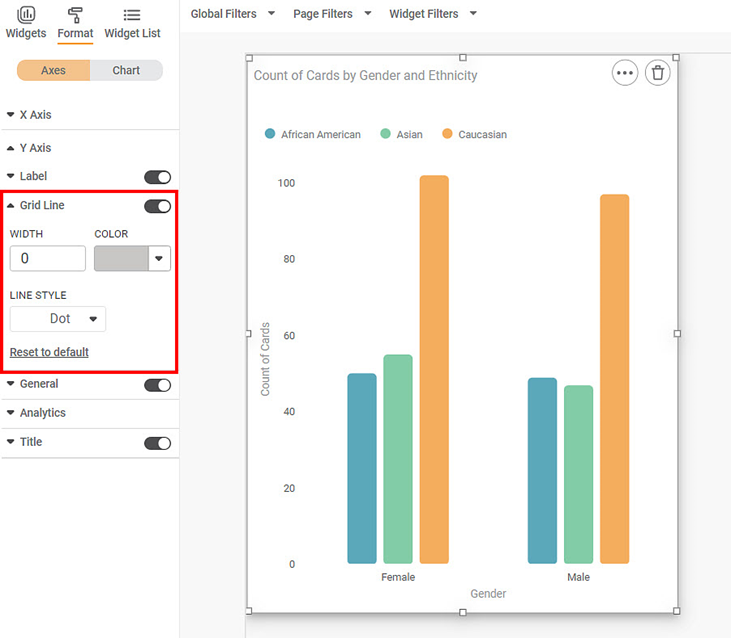
Now, change the
- Gridline width
- Gridline color
- Gridline style
The resultant widget is shown below.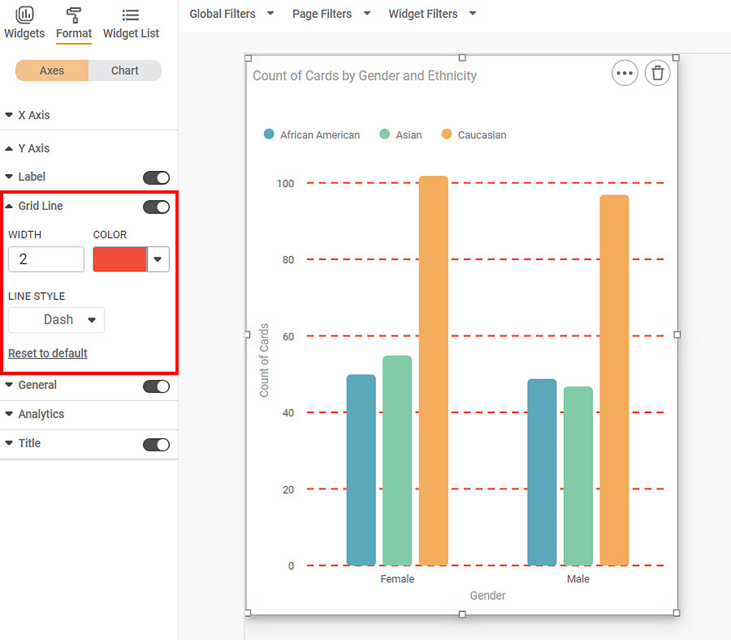
Note: | In any of the above formatting options, click Reset to default to change the widget back to its original settings, and undo all changes. |
Related Articles
Canvas Grid Functionality
Grid support helps designers align and organize visuals precisely on the canvas using an underlying layout structure. Overview Grid is available for Rubisight Designers The grid is visible only in Edit Mode It helps in maintaining consistent spacing ...Grid Line
Gridlines are a crisscross mesh of lines drawn in the region between X and Y axes in a graph or chart. The table given below describes different fields present on Grid Line formatting on Y-axis. Field Description Remark Width It allows you to select ...Grid
Grid formatting option is available in widgets that contain Tables. By default, the Grid formatting options are not visible. Turn the toggle button ON () to use the Grid formatting options. The table given below describes different fields present on ...Line Style
Line Style feature allows you to customize the appearance of the lines in the widgets. It helps you to tailor the visualizations to meet your specific needs and preferences. This feature is available in the following widgets: Line, Pareto, ...Fixed Line
The figure given below shows the Add Fixed Line page. The table given below describes different fields present on Add Fixed Line page. Section Field Description Remark Line Name It allows you to select a name for the Fixed Line. · Select a proper ...