Highlight
The Highlight option is used for conditional formatting of the chart. You can change the look and feel of the chart based on conditions that you can configure.
This option is available for Line Chart, Bar Chart, Column Chart, Solid Guage Chart, Pie Chart and Donut Chart.
By default, the Highlight formatting options are not visible. Turn the Apply toggle button ON ( ) to format the background.
To use conditional formatting, first plot a chart. Here, we chart a Column chart of Count of Profit and Count of Sales by Category.
The figure given below shows an original image of the Column Chart.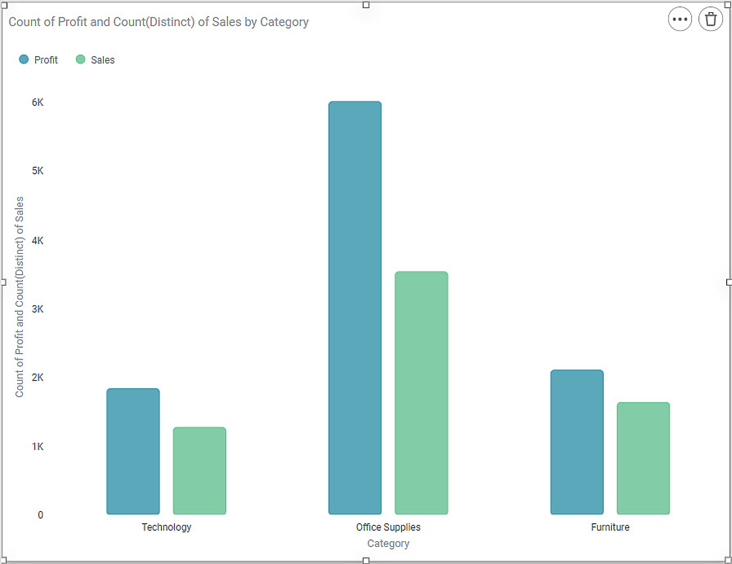
Now, we apply the Highlight option.
To apply conditional formatting, follow the steps given below.
- Turn the Apply toggle ON.
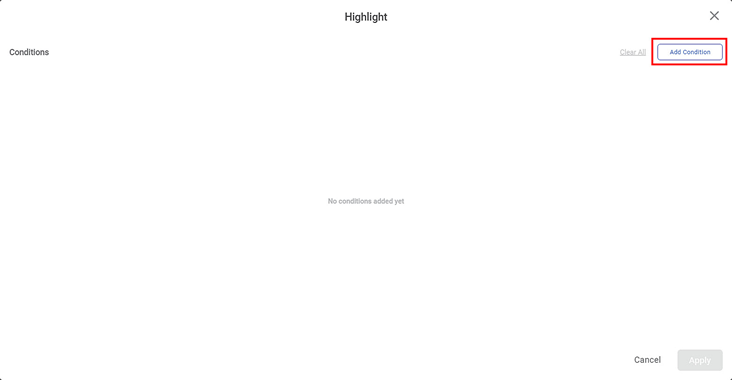
The Highlight page is displayed. - Click Add Condition.
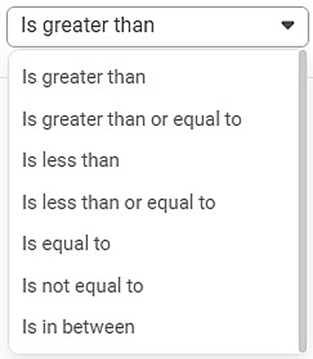
- Select the mathematical condition from the If value drop-down.
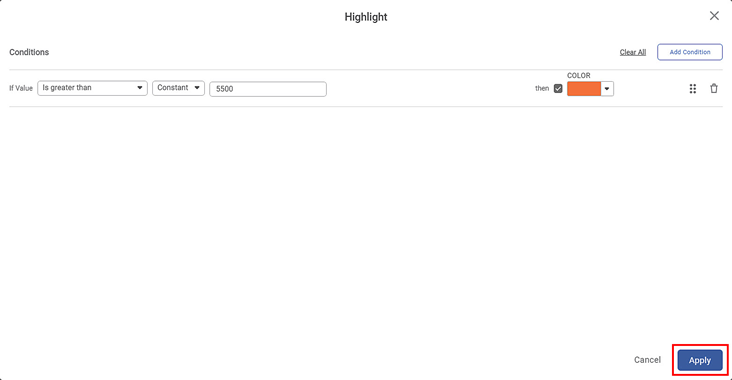
- Select the variable to be compared – Constant or Measure.
- If you select Measure, then select the measure from the drop-down. Else enter constant value.
- Select the then checkbox.
- Select color from the COLOR drop-down.
- Click Apply.
The conditional formatting is applied on the selected chart.
Notes: |
|
 ).
).The resultant widget is shown below.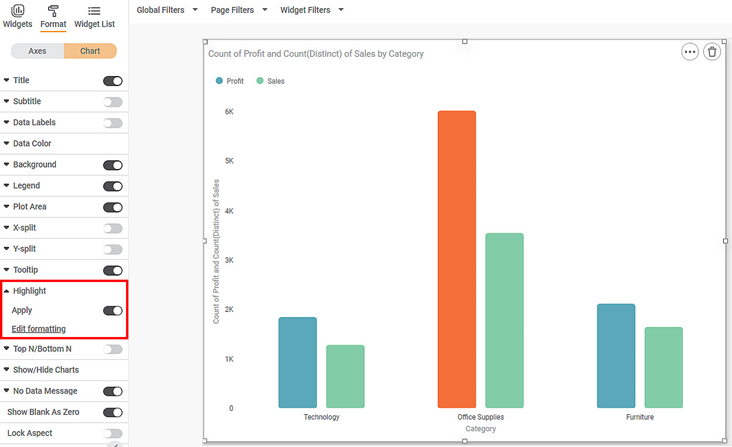
Highlight condition is also applicable when chart is plotted with legends. It is applicable to all the points in all the legends which satisfy the condition.
Consider the following line chart of sales against the ship mode. In the following chart all the points satisfying the condition are highlighted.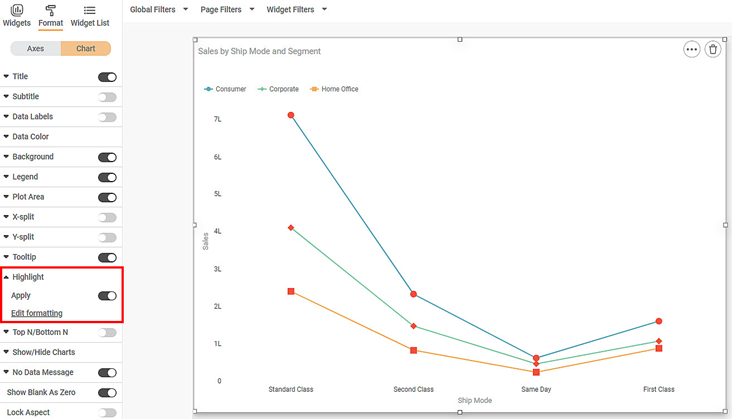
Related Articles
Highlight in Card Chart
Refer Highlight for the configuration of Highlight. Card widget configured without Highlight shows the values- 9.60K. After applying Highlight condition, Is less than 10000 sets Voilet Color. The condition gets satisfied, and the chart is displayed ...Highlight in Table
The Highlight option is used for the conditional formatting of a widget. You can change the look and feel of the widget based on conditions that are configured. The conditional formatting explained here highlights various data values present in table ...Highlight- Hide Values Support
The option Hide Values, is available to configure highlighting with or without showing data values. This option is available in Highlight configuration for Table, Sparkline and Cross Table. When data values are hidden, the Style Icon is shown or ...Highlight- Configure Retain Table Style
The option Retain Table Style, is available to configure highlight with table style retained. This option is available in Highlight configuration for Table, Sparkline and Cross Table. For Cross Table the highlight configuration done as below: The ...Highlight Formatting for Solid Guage Chart
Before you walk through the below guide to set the Highlight on Solid Guage chart, you can refer Highlight for getting more details of the Highlight option to set the conditional formatting on the chart. For Solid Guage chart, to set the Conditional ...