Highlight in Table
The Highlight option is used for the conditional formatting of a widget. You can change the look and feel of the widget based on conditions that are configured.
The conditional formatting explained here highlights various data values present in table widgets like Table, Cross Table, and Sparkline Chart.
To use the Highlight option, first, we plot a Table using a dataset as shown below.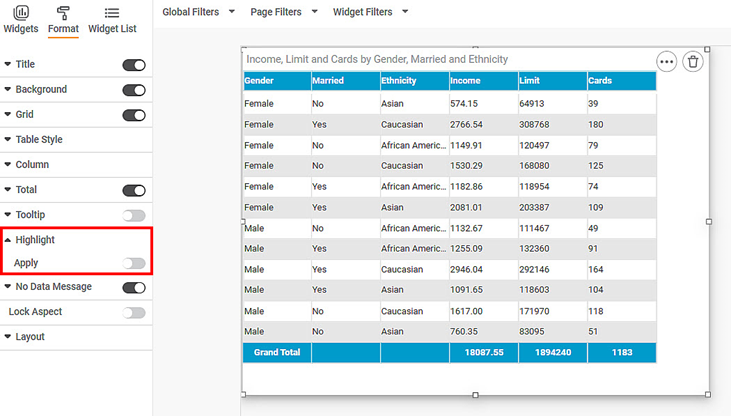
By default, the highlight formatting options do not appear in the same pane as they appear for other formatting options. They appear in a separate window where they are customized.
To add the highlight formatting conditions, follow the steps given below.
- Click Format to view the table formatting options.
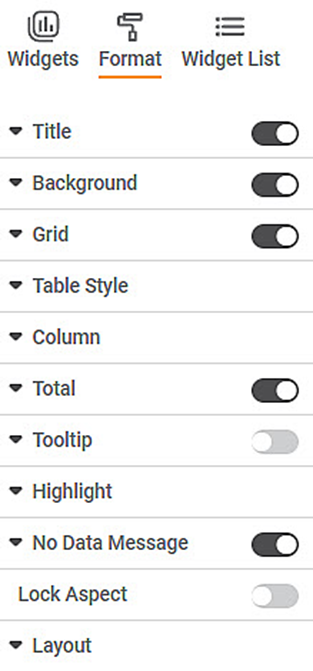
The various formatting options available for a table are displayed in the pane. - Click Highlight, and then turn the Apply toggle button ON (
 ).
).
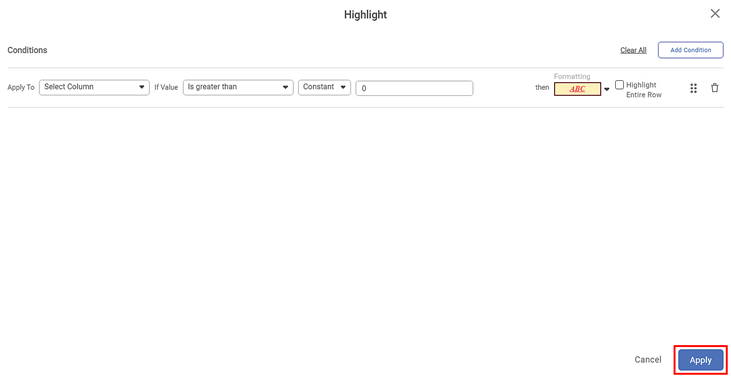
The Highlight page is displayed. - Click Add Condition.
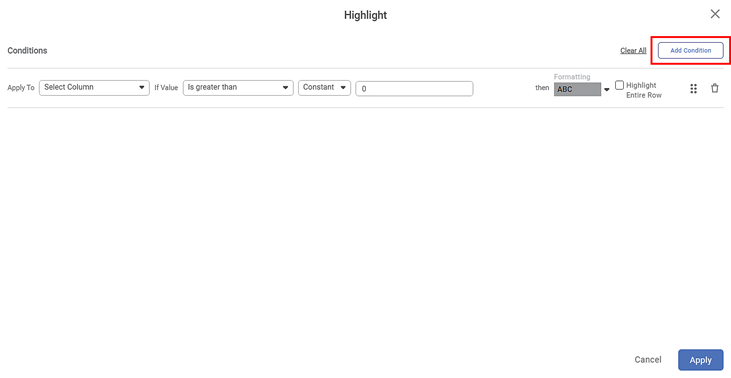
- Select the variable that you want to highlight from the Apply To drop-down.
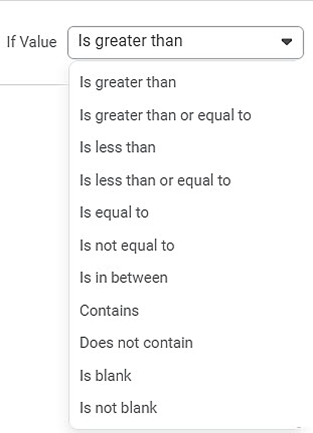
- Select the mathematical condition from the If Value drop-down.
Select Constant or Column from the drop-down depending upon the type of variable.
Notes:
- If you select a mathematical condition and Constant for which a value needs to be specified, enter the value in the field provided.
- If you select a Column, then the adjoining field displays a Select Column drop-down. The drop-down lists all columns present in the Table. You can select any one of the columns.
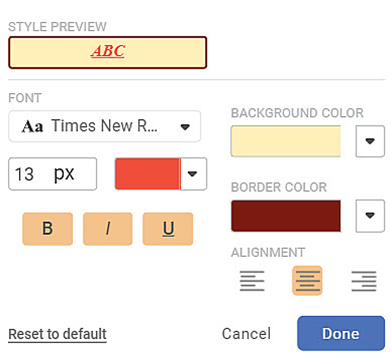
To select formatting styles, click the Formatting drop-down.
The style options are displayed. You can select the
- Font type, size, and color
- Background color
- Border color
- Alignment of the highlighted value.
You can also make the value bold, italic, or underline it.
Note:
You can highlight the entire row in Table and Sparkline Chart widget (containing the highlighted values), by selecting the Highlight Entire Row check box. However, this feature is not applicable to Cross Table widget.
After selecting the style options of your choice, click Done.
You can see the preview of the applied formatting style ( ) in the Formatting field.
Click Apply.
The dashboard page is displayed.
The formatting style gets applied to the value(s) in the Table as per the condition(s) added.
Here, in the plotted Table, the values >100 in the Cards column are displayed as shown in the figure given below.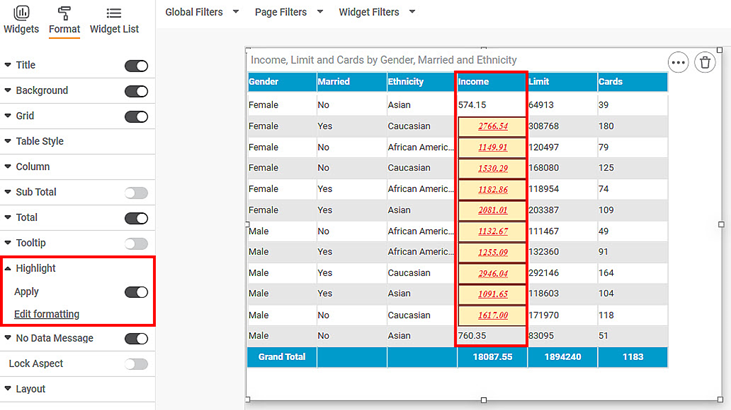
Notes: |
|
 ) to change the sequence of the conditions by moving them up or down.
 ) on the
 Related Articles
Highlight
The Highlight option is used for conditional formatting of the chart. You can change the look and feel of the chart based on conditions that you can configure. This option is available for Line Chart, Bar Chart, Column Chart, Solid Guage Chart, Pie ...Highlight- Configure Retain Table Style
The option Retain Table Style, is available to configure highlight with table style retained. This option is available in Highlight configuration for Table, Sparkline and Cross Table. For Cross Table the highlight configuration done as below: The ...Highlight in Table based on another column
The Highlight is configured with condition based on constant or another column in the configuration. The Highlight based on another column configuration is done as below: The chart data before adding highlight condition is displayed as below for ...Highlight in Card Chart
Refer Highlight for the configuration of Highlight. Card widget configured without Highlight shows the values- 9.60K. After applying Highlight condition, Is less than 10000 sets Voilet Color. The condition gets satisfied, and the chart is displayed ...Highlight- Hide Values Support
The option Hide Values, is available to configure highlighting with or without showing data values. This option is available in Highlight configuration for Table, Sparkline and Cross Table. When data values are hidden, the Style Icon is shown or ...