Poisson Regression
Poisson Regression is located under Machine Learning ( ) under Regression, in the left task pane. Use the drag-and-drop method to use the algorithm in the canvas. Click the algorithm to view and select different properties for analysis.
Refer to Properties of Poisson Regression.
Properties of Poisson Regression
The available properties of the Poisson Regression are as shown in the figure below.

The table below describes the different fields present on the Properties pane of the Poisson Regression.
Field | Description | Remark | |
| Run | It allows you to run the node. | - | |
| Explore | It allows you to explore the successfully executed node. | - | |
| Vertical Ellipses | The available options are
| - | |
Task Name | It is the name of the task selected on the workbook canvas. | You can click the text field to edit or modify the name of the task as required. | |
Dependent Variable | It allows you to select the numerical variable on which the regression is to be applied. | You can select any numerical type of variable which contains count values. | |
Advanced | Alpha | It allows you to set the level of significance. | The default value is 1.0. |
Maximum Iterations | It allows you to enter the maximum number of iterations. | The default value is 100. | |
Tolerance | It allows you to enter the precision of the solution. |
| |
Fit Intercept | It allows you to select whether you want to calculate constant (c) value for your model. |
| |
Warm Start | It allows you to select whether you want to use the existing fitted model attributes to initialize the new model in the next call to fit. |
| |
Verbose | It allows you to select whether you want to enable logging. |
| |
Dimensionality Reduction | It allows you to select the method for dimensionality reduction. |
| |
Add result as a variable | It allows you to select the KPIs to be displayed in the output. | The available options are
| |
Node Configuration | It allows you to select the instance of the AWS server to provide control on the execution of a task in a workbook or workflow. | For more details, refer to Worker Node Configuration. | |
Hyper Parameter Optimization | It allows you to select the parameters for optimization. | For more details, refer to Hyperparameter Optimization. | |
Example of Poisson Regression
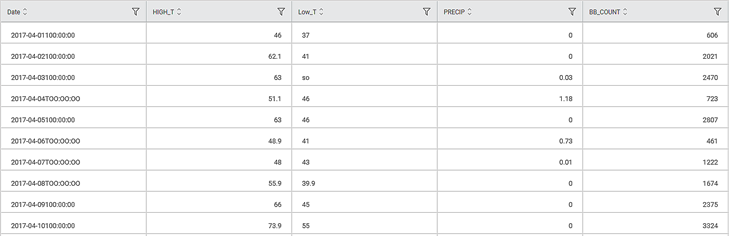
Consider a dataset of the credit card dataset in the example below. We select Income, Limit, Cards, Education, Age, and Balance as the independent variables and Rating as the dependent variable. The result of the XGBoost Regression is displayed in the figure below.
We select rating as the Dependent Variable. The Result page of the Poisson Regression is displayed in the figure below.
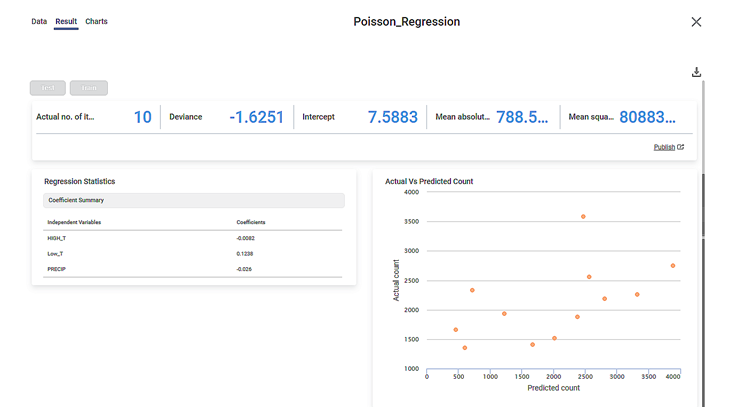
As seen in the above figure, the KPIs for Poisson Regression, the Regression Statistics containing coefficients for the independent variables, and a scatter plot of Actual Vs Predicted count is displayed on the Result page.
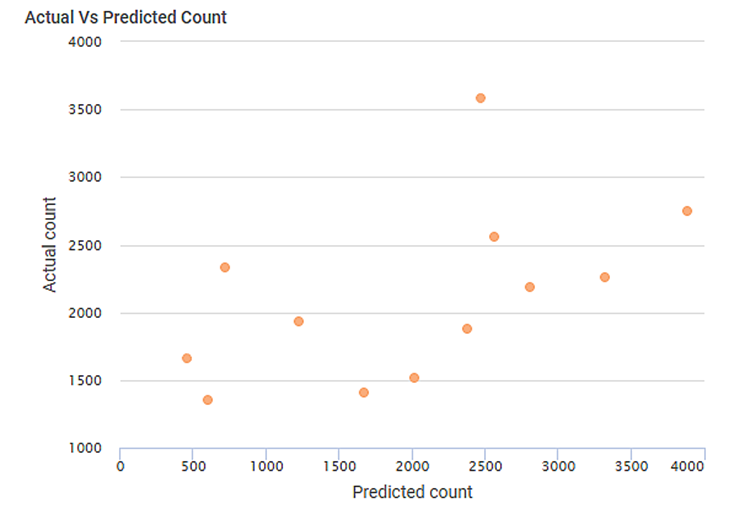
When you hover over any point of the scatter plot, you see the Predicted Count and Actual Count values for the data point.
Related Articles
Random Forest Regression
Random Forest Regression is located under Machine Learning ( ) > Regression > Random Forest Regression Use the drag-and-drop method (or double-click on the node) to use the algorithm in the canvas. Click the algorithm to view and select different ...Decision Tree Regression
Decision Tree Regression is located under Machine Learning ( ) > Regression > Decision Tree Regression Use the drag-and-drop method (or double-click on the node) to use the algorithm in the canvas. Click the algorithm to view and select different ...Coefficient Summary
Overview Rubiscape now provides Coefficient Summary support for Ridge, Lasso, and Poisson regression, extending the existing functionality available for Linear and Polynomial Regression. This ensures all supported regression models display their ...Linear Regression
Linear Regression is located under Machine Learning ( ) in Regression, in the task pane on the left. Use the drag-and-drop method to use the algorithm in the canvas. Click the algorithm to view and select different properties for analysis. Refer to ...Polynomial Regression
Polynomial Regression is located under Machine Learning () under Regression, in the left task pane. Use the drag-and-drop method to use the algorithm in the canvas. Click the algorithm to view and select different properties for analysis. Refer to ...