Polynomial Regression
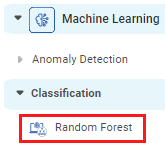
Polynomial Regression is located under Machine Learning ( ) under Regression, in the left task pane. Use the drag-and-drop method to use the algorithm in the canvas. Click the algorithm to view and select different properties for analysis.
Refer to Properties of Polynomial Regression.
Properties of Polynomial Regression
The available properties of Polynomial Regression are as shown in the figure given below.
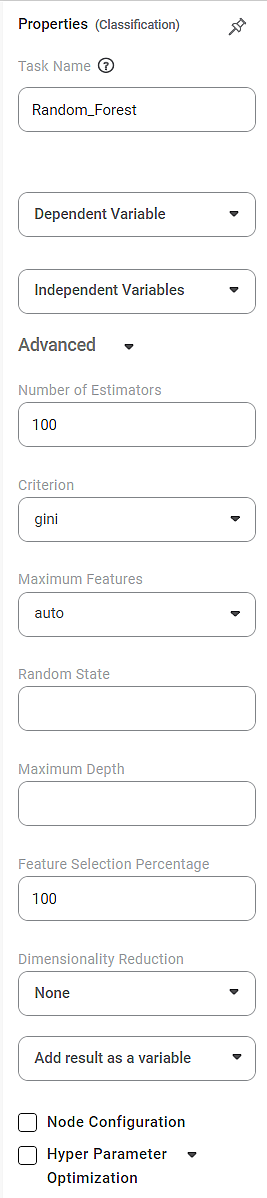
The table given below describes the different fields present on the Properties pane of Polynomial Regression.
Field | Description | Remark | |
| Run | It allows you to run the node. | - | |
| Explore | It allows you to explore the successfully executed node. | - | |
| Vertical Ellipses | The available options are
| - | |
Task Name | It is the name of the task selected on the workbook canvas. | You can click the text field to edit or modify the name of the task as required. | |
Dependent Variable | It allows you to select the dependent variable. |
| |
Independent Variables | It allows you to select independent variables. |
| |
Advanced | Degree | It allows you to select the degree of the polynomial equation to be used. | The default value is 2. |
Interaction Only | It allows you to select whether interaction features are to be produced. |
| |
Include Bias | It allows you to select whether bias is to be included. |
| |
Dimensionality Reduction | It allows you to select the method for dimensionality reduction. |
| |
Add result as a variable | It allows you to select whether the result of the algorithm is to be added as a variable. | For more details, refer to Adding Result as a Variable. | |
Node Configuration | It allows you to select the instance of the AWS server to provide control on the execution of a task in a workbook or workflow. | For more details, refer to Worker Node Configuration. | |
Hyper Parameter Optimization | It allows you to select parameters for optimization. | For more details, refer to Hyperparameter Optimization. | |
Example of Polynomial Regression
Consider a dataset of Credit Card balances of people of different gender, age, education, and so on. A snippet of input data is shown in the figure given below.
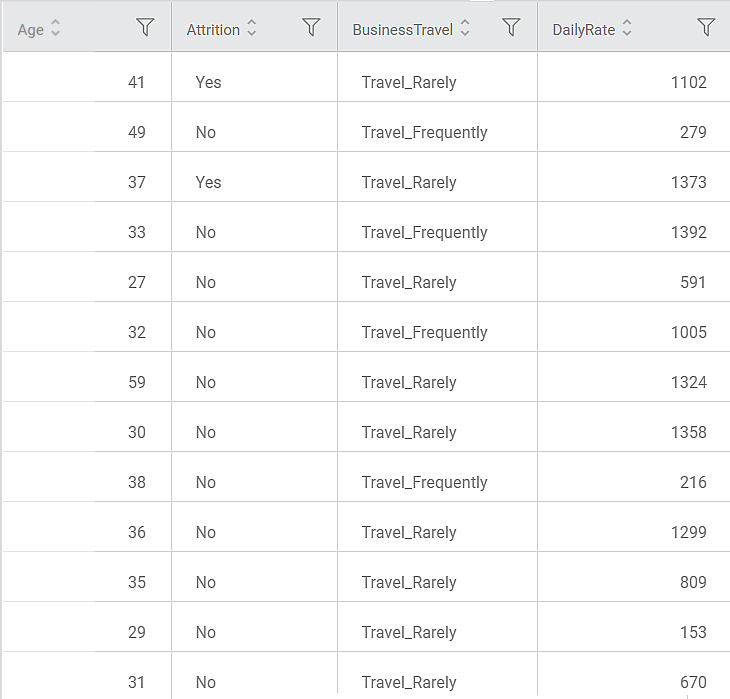
We select Limit, Balance, Income, and Cards as the independent variables and Rating as the dependent variable. The result of the Polynomial Regression is displayed in the figure below.
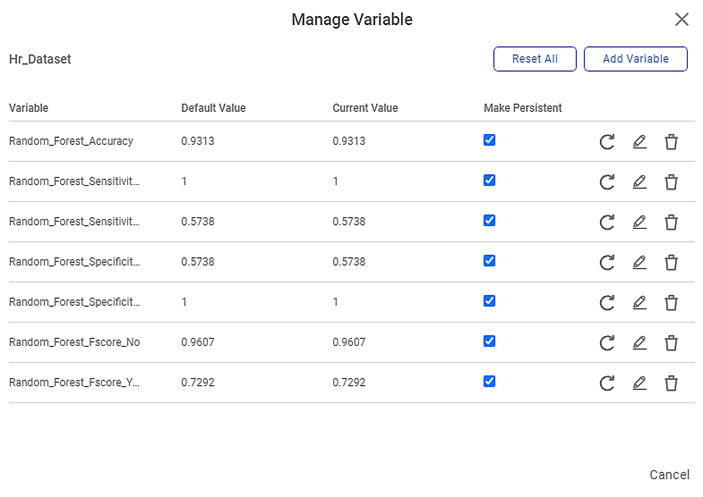
As seen in the above figure, on the Result page, under the Regression Statistics, the Performance Metrices and Coefficient Summary are displayed.
The table below describes the various performance metrics on the result page.
Performance Metric | Description | Remark |
|---|---|---|
RMSE (Root Mean Squared Error) | It is the square root of the averaged squared difference between the actual values and the predicted values. | It is the most commonly used performance metric of the model. |
R Square | It is the statistical measure that determines the proportion of variance in the dependent variable that is explained by the independent variables. | Value is always between 0 and 1. |
Adjusted R Square | It is an improvement of R Square. It adjusts for the increasing predictors and only shows improvement if there is a real improvement. | Adjusted R Square is always lower than R Square. |
AIC (Akaike Information Criterion) | AIC is an estimator of errors in predicted values and signifies the quality of the model for a given dataset. | A model with the least AIC is preferred. |
BIC | BIC is a criterion for model selection amongst a finite set of models. | A model with the least BIC is preferred. |
| MSE (Mean Squared Error) | It is the averaged squared difference between the actual values and the predicted values. | A model with low MSE is preferred. |
| MAE (Mean Absolute Error) | It the absolute value of difference between actual and predicted values | A model with low MAE is preferred. |
| MAPE ( Mean Absolute Percentage Error) | it is the average magnitude of error produced by a model, or how far off predictions are on average. | A model with low MAPE is preferred |
On the Result page, when you scroll down Number of Input and Output features are also displayed, as shown in the figure below.
- It indicates the relevance of each of the independent variables to the dependent variable.
Related Articles
Support Vector Machine in Regression
The location of the Support Vector Machine is under Machine Learning in Regression on the feature studio. Alternatively, use the search bar to find Support Vector Machine (SVM) algorithm. Use the drag-and-drop method or double-click to use the ...Coefficient Summary
Overview Rubiscape now provides Coefficient Summary support for Ridge, Lasso, and Poisson regression, extending the existing functionality available for Linear and Polynomial Regression. This ensures all supported regression models display their ...Poisson Regression
Poisson Regression is located under Machine Learning () under Regression, in the left task pane. Use the drag-and-drop method to use the algorithm in the canvas. Click the algorithm to view and select different properties for analysis. Refer to ...Linear Regression
Linear Regression is located under Machine Learning ( ) in Regression, in the task pane on the left. Use the drag-and-drop method to use the algorithm in the canvas. Click the algorithm to view and select different properties for analysis. Refer to ...Ridge Regression
Ridge Regression is located under Machine Leaning ( ) under Regression, in the left task pane. Use the drag-and-drop method to use the algorithm in the canvas. Click the algorithm to view and select different properties for analysis. Refer to ...