Support Vector Machine
Support Vector Machine is located under Textual Analysis (  ) in Classification, in the left task pane. Use the drag-and-drop method to use the algorithm in the canvas. Click the algorithm to view and select different properties for analysis.
Refer to Properties of Support Vector Machine.
Properties of Support Vector Machine
The available properties of the Support Vector Machine are as shown in the figure below.
The table below describes the different fields present on the properties of the Support Vector Machine.
Field | Description | Remark | |
| Run | It allows you to run the node. | - | |
| Explore | It allows you to explore the successfully executed node. | - | |
| Vertical Ellipses | The available options are
| - | |
Task Name | It is the name of the task selected on the workbook canvas. | You can click the text field to edit or modify the task name as required. | |
Dependent Variable | It allows you to select a feature as the dependent variable. | You can select any one feature as the dependent variable. | |
Text | It allows you to select independent variables. | You can select more than one variable. | |
Advanced | Penalty Parameter | It allows you to select the value introduced as a penalty to overcome the overfitting problem. | You can select any float value as a penalty parameter. |
Kernel | It allows you to select the kernel function to convert your data into a required form. |
| |
Gamma | It allows you to select the gamma parameter. |
| |
Degree | It allows you to select the degree of the polynomial kernel function. | It is applicable only when you select the poly as the kernel function. | |
Random State | It allows you to select a random combination of train and test for the classifier. |
| |
Add result as a variable | It allows you to select any of the result parameters as the variable. | You can select from the following performance parameters of SVM:
| |
Node Configuration | It allows you to select the instance of the AWS server to provide control on the execution of a task in a workbook or workflow. | For more details, refer to Worker Node Configuration. | |
Hyperparameter Optimization | It allows you to select parameters for optimization. | For more details, refer to Hyperparameter Optimization. | |
Example of Support Vector Machine
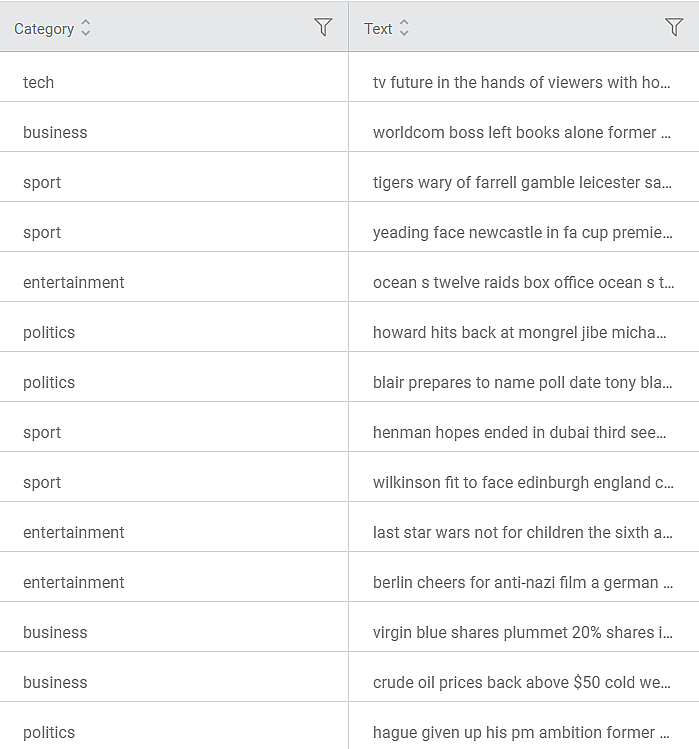
Consider a dataset containing BBC news snippets classified into different categories like tech, business, sport, politics, and so on. A snippet of input data is shown in the figure given below.
We select the following properties and apply Support Vector Machine.
Dependent Variable | Category |
Text | Text |
Penalty Parameter | 1.0 |
Kernel | Sigmoid |
Gamma | Auto |
Degree | — |
Random State | — |
After using the Support Vector Machine, the following results are displayed. On the result page, you can see the following output parameters
- Accuracy, F-score, Sensitivity, and Specificity are the model performance indicators displayed on the Results page.
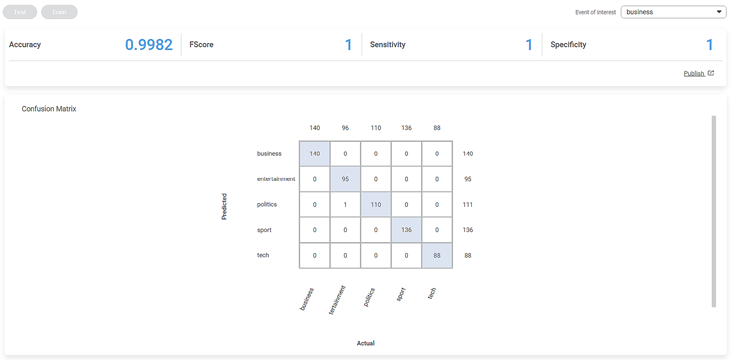
- The Accuracy of the above SVM model is 0.9982, and F-score, Sensitivity, and Specificity are 1 each.
On the same result page, you see the confusion matrix containing predicted and actual values for Category.
- The shaded diagonal cells show the correctly predicted categories. For example, all 140 pieces of news in the business category are correctly predicted.
- The remaining cells indicate the wrongly predicted categories. For example, one (1) news in the entertainment category is wrongly predicted as belonging to the politics
The figure below shows the resultant dataset in the Data tab.
- Along with the Index and Text columns, you can see the Category column showing the original categories.
- The predicted categories for each text are listed under the Label
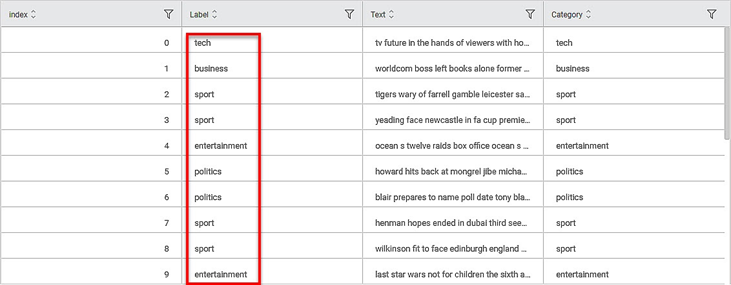
- You can compare Label and Category columns to check them correctly and wrongly predicted categories.
Related Articles
Support Vector Machine in Regression
The location of the Support Vector Machine is under Machine Learning in Regression on the feature studio. Alternatively, use the search bar to find Support Vector Machine (SVM) algorithm. Use the drag-and-drop method or double-click to use the ...Task Wise GPU Integration for Machine Learning Algorithms.
Overview GPU execution support has been introduced for supported Machine Learning algorithms to improve processing performance, execution efficiency, and scalability for machine learning workloads. Users can now enable GPU execution at task level for ...MLOPS - Machine Learning Operations
Introduction: Why Rubiscape MLOps? Rubiscape MLOps provides an end-to-end environment for building, tracking, publishing, and serving machine learning models. It ensures experiment reproducibility, streamlined deployment, and centralized model ...Usage of Variables
In Rubiscape, you can add a variable at the workbook or workflow level. Refer to Adding a Variable. Rubiscape provides variable support, that is, its usage, for all tasks anywhere in workbooks or workflows like creating a dataset, performing data ...Usage of Variables
In Rubiscape, you can add a variable at the workbook or workflow level. Refer to Adding a Variable. Rubiscape provides variable support, that is, its usage, for all tasks anywhere in workbooks or workflows like creating a dataset, performing data ...