Building Algorithm Flow in a Workbook Canvas
The workbook canvas is your experimental area.
You can create, run, and train your algorithm flow in workbook canvas using a simple drag-and-drop method, to add datasets and algorithms.
The table given below provides major differences between the workbook and workflow.
Workbook Canvas | Workflow Canvas |
|---|---|
It is an experimental area where you train your datasets and algorithms. | It is the production area where trained datasets are used to publish your algorithms as models. |
It also contains classification and regression algorithms, along with other algorithms. | It contains all algorithms present in the workbook, except classification and regression algorithms. |
You cannot schedule algorithms to run later. | You can schedule your final algorithms to run automatically at specific time intervals. |
To use canvas, follow the steps given below.
Notes: |
|
- Open the Workspace where you want to create your workbook. Refer to Changing Workspace.
- Create a Workbook. Refer to Creating a Workbook.
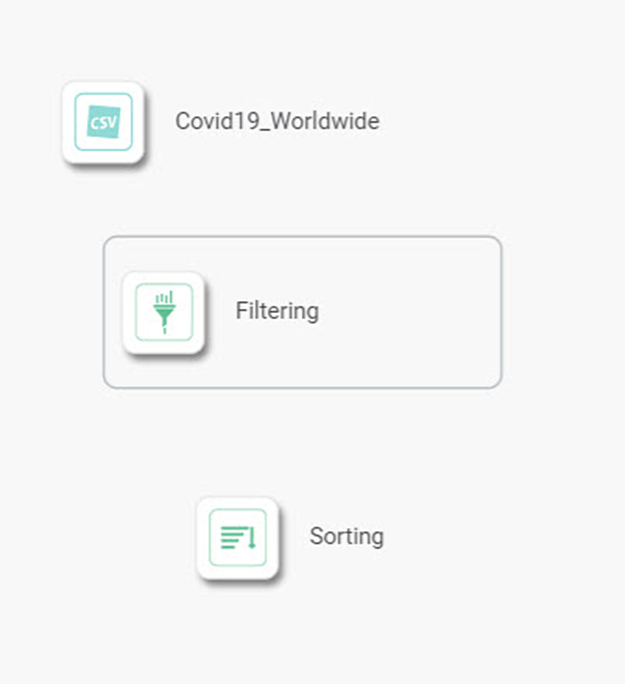
Use the drag-and-drop method to insert readers and algorithms from the Task Pane into the canvas.
 Note:
Note: You can also double-click on the reader or algorithm to add it to the canvas.
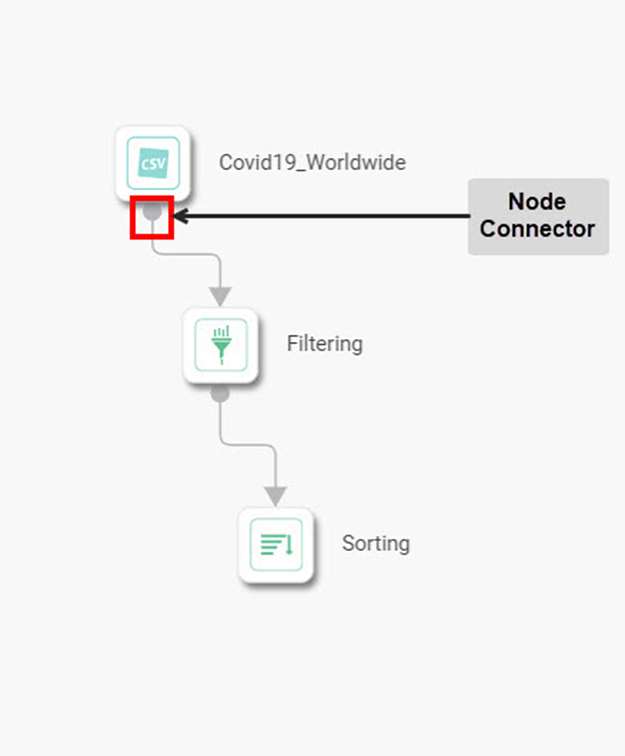
Click the reader/algorithm and click the Node Connector, and then click the other reader/algorithm that you want to join with it.
Similarly, join the other elements. Note: You can also join a single element to multiple elements if required.
- Click the reader/algorithm and select the Properties displayed on the right-hand side.
Here we have selected Data Fields (columns in your dataset) for the selected reader. Click the reader/algorithm and click the vertical ellipsis (
 ). The functions available for the elements are as follows.
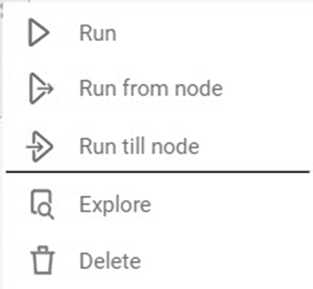 Note:
Note: Publish as a model is available only for Machine Learning, Regression, and Classification algorithms.
The table given below describes the functions present on the reader or algorithm.
Icon
Icon Name
Description

Run
It runs the selected node of the algorithm. Note: The predecessor node is expected to be successfully executed.

Run from Node
It runs all the nodes below, from the selected node.
Note: All nodes before this node are expected to be successfully executed.
Run till Node
It runs all the nodes from the top node, until the selected node.

Explore
It lets you explore the result of the selected node.
Note: You can explore only after the algorithm is successfully executed.
Publish as a Model
It publishes the algorithm flow as a model.
Note: You can publish models only in Data integrator for Machine Learning algorithms.
Delete
It deletes the node.
- Click the Save icon (
 ) on the function pane, to save the algorithm flow.
|
|
Related Articles
Building Algorithm Flow in a Forecasting Workbook Canvas
Building algorithm flow in a Forecasting Workbook is similar to that in Model Studio. To build algorithm flow in a Workbook Canvas in Model Studio, refer to Building Algorithm Flow in a Workbook Canvas.Building Algorithm Flow in a Workflow Canvas
Building algorithm flow in a Workflow Canvas is similar to building algorithm flow in a Workbook Canvas. You can use your trained algorithms here. To build algorithm flow in a Workflow Canvas, refer to Building Algorithm Flow in a Workbook Canvas. ...Workbook Validation
In Rubiscape, you can drag-and-drop algorithms and datasets on the workbook or workflow canvas to build a model. When you run the model, Rubiscape validates it before execution. The validation feature is used to notify the validation errors that ...Workbook Validation
In Rubiscape, you can drag-and-drop algorithms and datasets on the workbook or workflow canvas to build a model. When you run the model, Rubiscape validates it before execution. The validation feature is used to notify the validation errors that ...Editing a Workbook
To edit a workbook, follow the steps given below. On the home page, click Workbooks. Recent Workbooks for the selected workspace are displayed. Hover over the workbook you want to edit and click View. The workbook canvas is displayed. Edit the ...