Chi Square Test for Independence
 ) in Hypothesis Test, in Statistical Analysis, in the left task pane. Use the drag-and-drop method to use the algorithm in the canvas. Click the algorithm to view and select different properties for analysis. Refer to Properties of Chi Square Test for Independence.
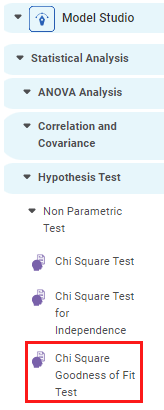
Properties of Chi Square Test for Independence
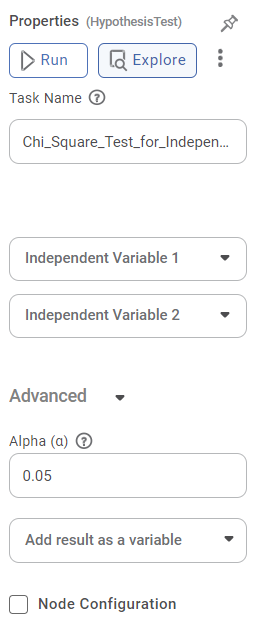
The available properties of the Chi Square Test for Independence are as shown in the figure given below.
Field | Description | Remark | |
| Run | It allows you to run the node. | - | |
| Explore | It allows you to explore the successfully executed node. | - | |
| Vertical Ellipses | The available options are
| - | |
Task Name | It is the name of the task selected on the workbook canvas. | You can click the text field to edit or modify the name of the task as required. | |
Independent Variable 1 | It allows you to select the first categorical variable for the independence test. | Only a Categorical variable can be selected. | |
Independent Variable 2 | It allows you to select the second categorical variable for the independence test. | Only a Categorical variable can be selected. | |
Advanced | Alpha | It allows you to set the level of significance. | The default value is 0.05. |
Node Configuration | It allows you to select the instance of the AWS server to provide control on the execution of a task in a workbook or workflow. | For more details, refer to Worker Node Configuration. | |
Example of Chi Square Test for Independence
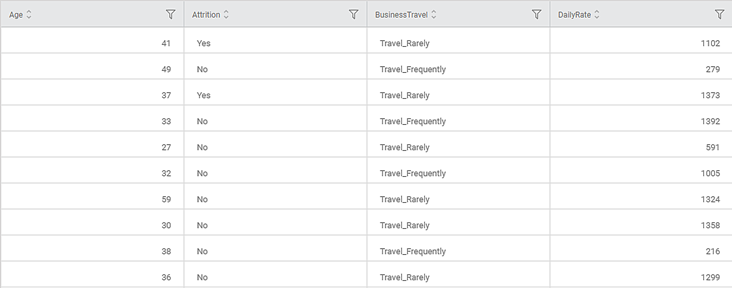
Consider a dataset of Credit Card balances of people of different gender, age, education, and so on. A snippet of input data is shown in the figure given below.
Property | Value |
Independent Variable 1 | Ethnicity |
Independent Variable 2 | Gender |
Alpha | 0.05 |
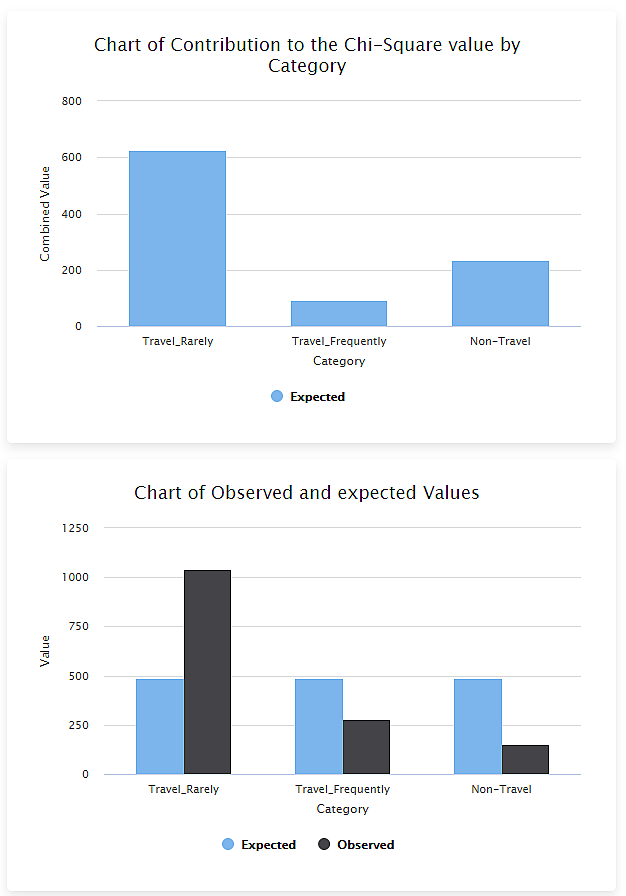
The Observed Frequency and Expected Frequency Tables are cross tables. They display the values for the selected categorical variables - Ethnicity and Gender.
In this case, the Chi Square Statistic (0.2735) is less than the p Value ((0.8722). This indicates that the selected categorical variables Ethnicity and Gender are associated with each other – a relationship exists between these two variables.
Related Articles
Chi Square Test
The Chi-Square test is located under Model Studio > Statistical analysis > Hypothesis Test > Non Parametric Test. Alternatively, use the search bar to find the Chi-Square test feature. Use the drag-and-drop method or double-click to use the algorithm ...Chi Square Goodness of Fit Test
Chi Square Goodness of Fit Test is located under Model Studio ( ) in Hypothesis Test, in Statistical Analysis, in the left task pane. Use the drag-and-drop method to use the algorithm in the canvas. Click the algorithm to view and select different ...Two Sample Z Test
Two Sample Z Test Description Two sample Z test is a statistical test used to determine whether there is a significant difference between the means of two independent variables. Why to use To compare the means of two independent variables When to use ...Train Test Split
Train Test Split is located under Model Studio () under Sampling in Data Preparation, in the left task pane . Use the drag-and-drop method to use the algorithm in the canvas. Click the algorithm to view and select different properties for analysis. ...Train Test Split
Train Test Split is located under Model Studio ( ) under Sampling in Data Preparation, in the left task pane . Use the drag-and-drop method to use the algorithm in the canvas. Click the algorithm to view and select different properties for analysis. ...