Data Value
The Data Value formatting option is available in Bullet Chart.
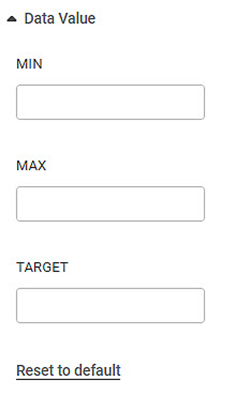
This allows you to select the Minimum, Maximum, and Target values for the chart.
Note: | These options are visible only if Min/Max/Target is not selected in the Widget Configuration. You can enter custom values here once they appear. |
The table given below describes different fields present for Data Value formatting.
Field | Description | Remark |
|---|---|---|
Minimum | The minimum value to be plotted for the Gauge Chart. | — |
Maximum | The maximum value to be plotted for the Gauge Chart. | — |
Target | The Target value is for comparing how far along the actual value has reached on the scale as compared to the target value. | — |
To use Data Value formatting options, first plot a Bullet Chart using the dimensions and measures from the dataset. But do not select Minimum, Maximum, and Target values in the Widget configuration. For example, we plot a Bullet Chart of the Income.
The figure given below shows an original image of the Bullet Chart.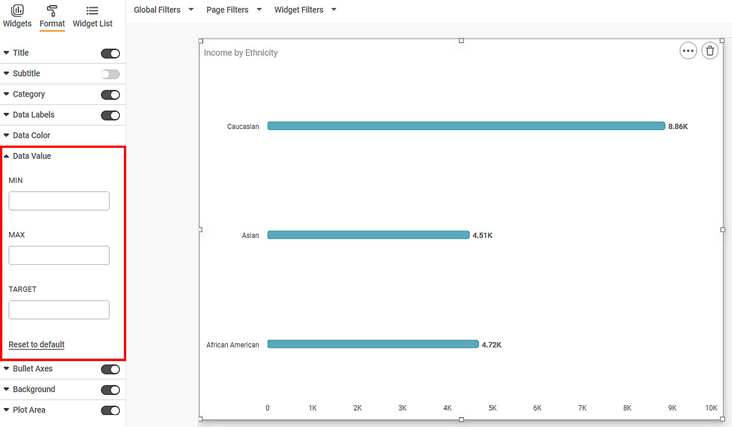
Now,
- Enter MIN value
- Enter MAX value
- Enter TARGET value
Note: | In order to see reflected changes of target value on the chart properly, the expected order of magnitude of data is minimum < value < target < maximum or minimum < target < value < maximum. |
The resultant widget is shown below.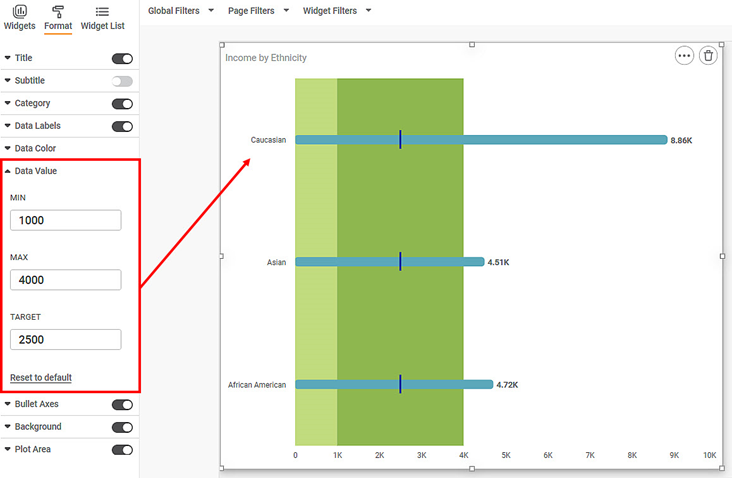
Related Articles
Data Value
The Data Value formatting option is available in Bullet Chart. This allows you to select the Minimum, Maximum, and Target values for the chart. Note: These options are visible only if Min/Max/Target is not selected in the Widget Configuration. You ...Missing Value Imputation
Missing Value Imputation is located under Model Studio ( ) in Data Preparation, in the task pane on the left. Use the drag-and-drop method to use algorithm in the canvas. Click the algorithm to view and select different properties for analysis. Refer ...Missing Value Imputation
Missing Value Imputation is located under Model Studio ( ) in Data Preparation, in the task pane on the left. Use the drag-and-drop method to use algorithm in the canvas. Click the algorithm to view and select different properties for analysis. Refer ...Live Data
Data visualization is the representation of data in the form of pictures, images, graphs, or any other form of visual illustration. In RubiThings, Live Data is visualized in the form of Line Chart, SolidGauge, and Speedometer. To fetch the live data, ...Data Preparation
Time-series Data Preparation organizes and formats transactional data into time-series data to predict trends and seasonality in the data. Transactional data is timestamped data recorded over a period at no specific frequency, while time-series data ...