Missing Value Imputation
Missing Value Imputation is located under Model Studio ( .png) ) in Data Preparation, in the task pane on the left. Use the drag-and-drop method to use algorithm in the canvas. Click the algorithm to view and select different properties for analysis.
) in Data Preparation, in the task pane on the left. Use the drag-and-drop method to use algorithm in the canvas. Click the algorithm to view and select different properties for analysis.
Refer to Properties of Missing Value Imputation.
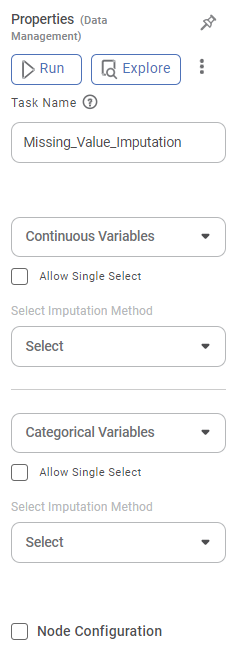
Properties of Missing Value Imputation
Field | Description | Remark |
|---|---|---|
| Run | It allows you to run the node. | - |
| Explore | It allows you to explore the successfully executed node. | - |
| Vertical Ellipses | The available options are
| - |
Task Name | It displays the name of the selected task. | You can click the text field to edit or modify the name of the task as required. |
Continuous Variables | It allows you to select continuous variables to perform missing value imputation. |
|
Allow Single Select | It allows you to impute individual missing values separately, for selected data fields. |
|
Select Imputation Method | It allows you to select the imputation method from the drop-list to apply for the selected data fields. | The available imputation methods are,
|
Categorical Variables | It allows you to select continuous variables to perform missing value imputation. |
|
Allow Single Select | It allows you to select the check box if you want to impute individual missing values separately, for selected data fields. |
|
Select Imputation Method | It allows you to select the imputation method from the drop-list to apply for the selected data fields. | The available imputation methods are,
|
Related Articles
Missing Value Imputation
Missing Value Imputation is located under Model Studio ( ) in Data Preparation, in the task pane on the left. Use the drag-and-drop method to use algorithm in the canvas. Click the algorithm to view and select different properties for analysis. Refer ...Missing Time Imputation
Missing Time Imputation is located under Forecasting > Data Preparation > Missing Time Imputation Use the drag-and-drop method to use the algorithm in the canvas. Click the algorithm to view and select different properties for analysis. Imputing ...Classification
Notes: The Reader (Dataset) should be connected to the algorithm. Missing values should not be present in any rows or columns of the reader. To find out missing values in a data, use Descriptive Statistics. Refer to Descriptive Statistics. If missing ...Batch Processing
Pipeline allows you to divide the dataset/Tasks into batches and then process it. Batch processing is mainly used to simplify many ETL operations like Missing value Imputation, expression, and validating data. You can specify the batch size called ...Batch Processing
Working with Batches Workflow in Data Integrator allows you to divide the dataset into batches and then process it. Batch processing is mainly used to simplify many ETL operations like Missing value Imputation, expression, and validating data. You ...