Extreme Gradient Boost Regression (XGBoost)
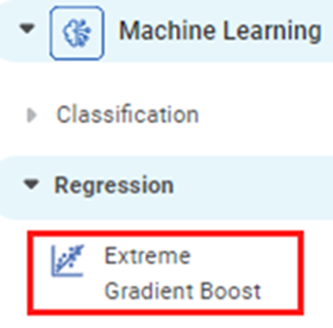
XGBoost Regression is located under Machine Learning ( ) in Regression, in the left task pane. Use the drag-and-drop method to use the algorithm in the canvas. Click the algorithm to view and select different properties for analysis.
Refer to Properties of XGBoost Regression.
Properties of XGBoost Regression
The available properties of XGBoost Regression are as shown in the figure given below.
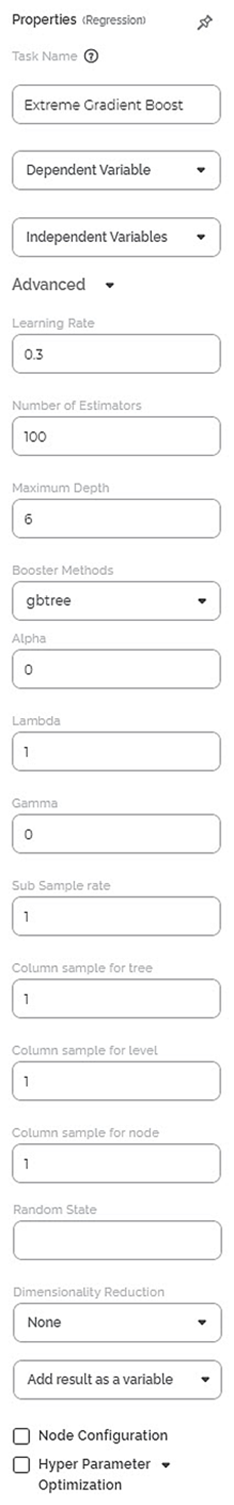
The table given below describes the different fields present on the Properties pane of XGBoost Regression.
Field | Description | Remark | |
|---|---|---|---|
| Run | It allows you to run the node. | - | |
| Explore | It allows you to explore the successfully executed node. | - | |
| Vertical Ellipses | The available options are
| - | |
Task Name | It is the name of the task selected on the workbook canvas. | You can click the text field to edit or modify the name of the task as required. | |
Dependent Variable | It allows you to select the dependent variable. | You can select only one variable, and it should be of numeric type. | |
Independent Variables | It allows you to select Independent variables. |
| |
Advanced | Learning Rate | It allows you to enter the boosting learning rate. | The default value is 0.3. |
Number of Estimators | It allows you to enter the Number of gradient boosted trees. It is equivalent to the number of boosting rounds. | The default value is 100. | |
Maximum Depth | It allows you to enter the maximum tree depth for base learners. | The default value is 6. | |
Booster Methods | It allows you to select the booster to use at each iteration. |
| |
Alpha | It allows you to enter a constant that multiplies the L1 term. | The default value is 0. | |
Lambda | It allows you to enter a constant that multiplies the L2 term. | The default value is 1. | |
Gamma | It allows you to enter the minimum loss reduction required to make a further partition on a leaf node of the tree. | The default value is 0. | |
Sub Sample rate | It allows you to enter the fraction of observations to be randomly sampled for each tree. | The default value is 1. | |
Column sample for tree | It allows you to enter the number of columns to be randomly sampled for each tree. | The default value is 1. | |
Column sample for level | It allows you to enter the subsample ratio of columns for each level. | The default value is 1. | |
Column sample for node | It allows you to enter the subsample ratio of columns for each node. | The default value is 1. | |
Random State | It allows you to enter the seed of the random number generator. | — | |
Dimensionality Reduction | It allows you to select the dimensionality reduction method. |
| |
Add result as a variable | It allows you to select whether the result of the algorithm is to be added as a variable. | For more details, refer to Adding Result as a Variable. | |
Node Configuration | It allows you to select the instance of the AWS server to provide control on the execution of a task in a workbook or workflow. | For more details, refer to Worker Node Configuration. | |
Hyper Parameter Optimization | It allows you to select parameters for optimization. | For more details, refer to Hyper Parameter Optimization. | |
Example of XGBoost Regression
Consider a dataset of Credit Card balances of people of different gender, age, education, and so on. A snippet of input data is shown in the figure given below.
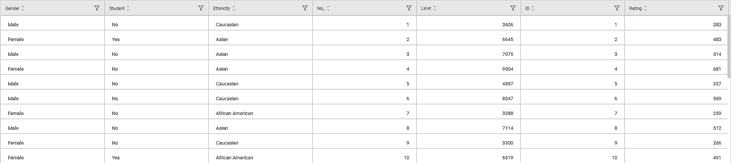
We select Income, Limit, Cards, Education, Age, and Balance as the independent variables and Rating as the dependent variable. The result of the XGBoost Regression is displayed in the figure below.
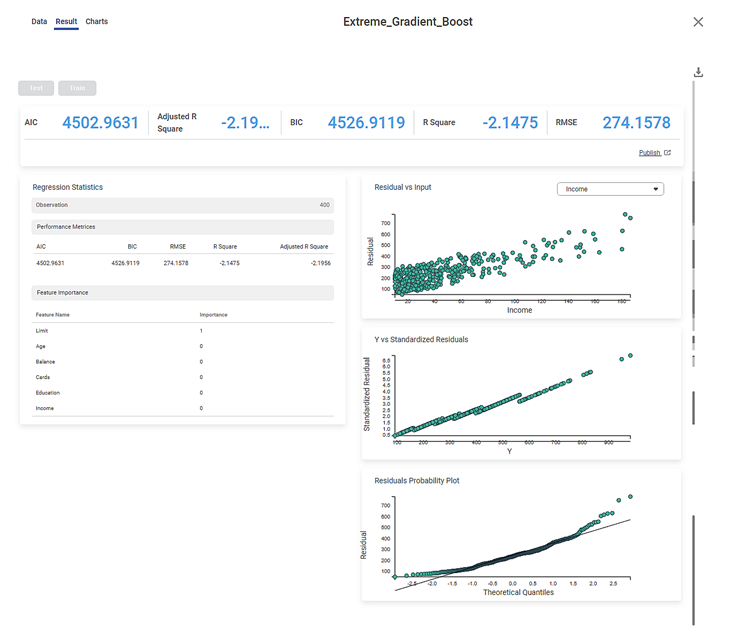
As seen in the above figure, on the Result page, under the Regression Statistics, the Performance Metrices, Variance Inflation Factor, and Feature Importance of all the features selected as independent variables are displayed.
The table below describes the various performance metrices on the result page.
Performance Metric | Description | Remark |
|---|---|---|
RMSE (Root Mean Squared Error) | It is the square root of the averaged squared difference between the actual values and the predicted values. | It is the most commonly used performance metric of the model. |
R Square | It is the statistical measure that determines the proportion of variance in the dependent variable that is explained by the independent variables. | Value is always between 0 and 1. |
Adjusted R Square | It is an improvement of R Square. It adjusts for the increasing predictors and only shows improvement if there is a real improvement. | Adjusted R Square is always lower than R Square. |
AIC (Akaike Information Criterion) | AIC is an estimator of errors in predicted values and signifies the quality of the model for a given dataset. | A model with the least AIC is preferred. |
BIC | BIC is a criterion for model selection amongst a finite set of models. | A model with the least BIC is preferred. |
| MSE (Mean Squared Error) | It is the averaged squared difference between the actual values and the predicted values. | A model with low MSE is preferred. |
| MAE (Mean Absolute Error) | It the absolute value of difference between actual and predicted values | A model with low MAE is preferred. |
| MAPE ( Mean Absolute Percentage Error) | it is the average magnitude of error produced by a model, or how far off predictions are on average. | A model with low MAPE is preferred |
The result page also shows tables that show Feature Importance for each of the selected independent (predictor) variables.
Feature importance refers to methods that assign a score to input features based on how useful they are for predicting the dependent variable. It indicates the relevance of each of the independent variables to the dependent variable.
Related Articles
Extreme Gradient Boost Classification (XGBoost)
Extreme Gradient Boost is located under Machine Learning () in Classification, in the task pane on the left. Use the drag-and-drop method (or double-click on the node) to use the algorithm in the canvas. Click the algorithm to view and select ...Gradient Boosting in Classification
The category Gradient Boosting is located under Machine Learning in Classification on the feature studio. Alternatively, use the search bar to find the Gradient Boosting test feature. Use the drag-and-drop method or double-click to use the algorithm ...Poisson Regression
Poisson Regression is located under Machine Learning () under Regression, in the left task pane. Use the drag-and-drop method to use the algorithm in the canvas. Click the algorithm to view and select different properties for analysis. Refer to ...Linear Regression
Linear Regression is located under Machine Learning ( ) in Regression, in the task pane on the left. Use the drag-and-drop method to use the algorithm in the canvas. Click the algorithm to view and select different properties for analysis. Refer to ...Ridge Regression
Ridge Regression is located under Machine Leaning ( ) under Regression, in the left task pane. Use the drag-and-drop method to use the algorithm in the canvas. Click the algorithm to view and select different properties for analysis. Refer to ...