X-Split
The X-split formatting option allows you to split a single widget horizontally into multiple widgets based on the selected dimension.
Notes: |
|
The figure given below shows the available formatting options for X-split.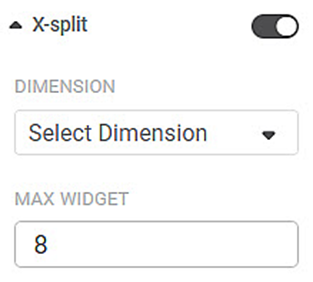
The table given below describes fields present on X-split formatting.
Field | Description | Remark |
|---|---|---|
DIMENSION | It allows you to select the dimension on which you want to split the widget horizontally. | — |
MAX WIDGET | It allows you to select the maximum number of widgets to split into. |
|
To use X-split formatting options, first plot any chart except for Table, Cross Table, Text, HTML, Image, or Sparkline.
Here, we plot a column chart of Total by Region.
By default, X-split is turned off.
The figure given below shows an original image of the Column Chart.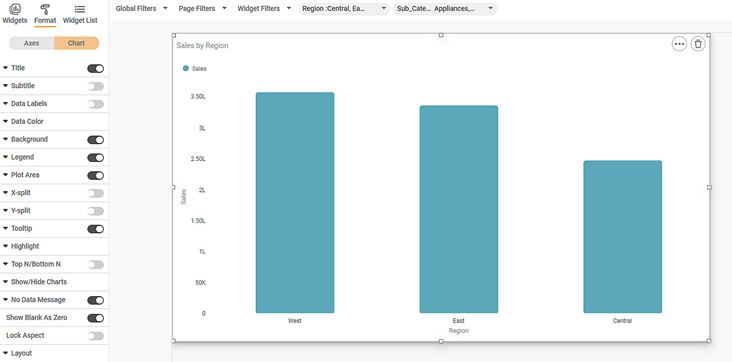
Now,
- Turn the X-split toggle on
- Select dimension to split on
- Select the maximum number of widgets
The resultant widget is shown below.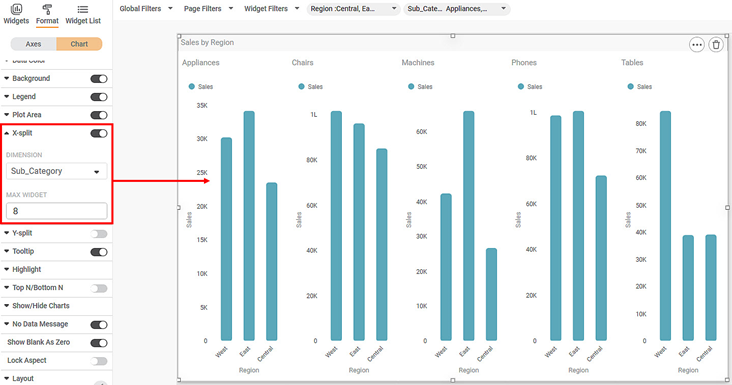
Notes: |
|