Y-split
The Y-split formatting option allows you to split a single widget vertically into multiple widgets based on the selected dimension.
Notes: |
|
The figure given below shows the available formatting options for Y-split.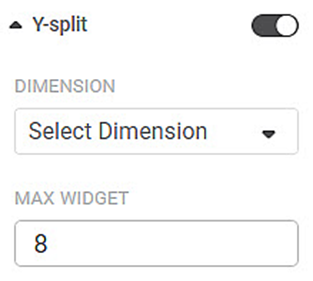
The table given below describes fields present on Y-split formatting.
Field | Description | Remark |
|---|---|---|
DIMENSION | It allows you to select the dimension on which you want to split the widget vertically. | — |
MAX WIDGET | It allows you to select the maximum number of widgets to split into. |
|
To use Y-split formatting options, first plot any chart except for Table, Cross Table, Text, HTML, Image, or Sparkline.
Here, we plot a pie chart of Total by Item.
By default, Y-split is turned off.
The figure given below shows an original image of the Pie Chart.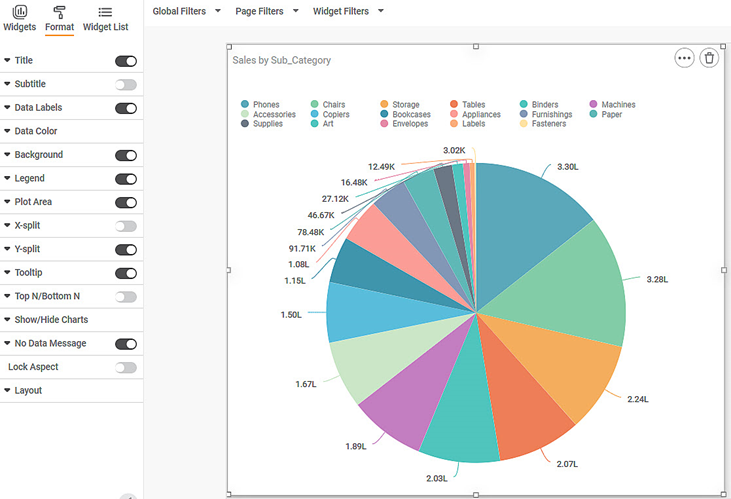
Now,
- Turn the Y-split toggle on
- Select dimension to split on
- Select the maximum number of widgets
The resultant widget is shown below.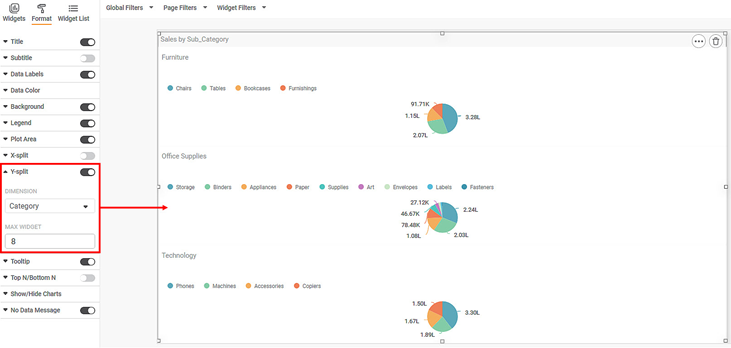
Notes: |
|
Related Articles
X-Split
The X-split formatting option allows you to split a single widget horizontally into multiple widgets based on the selected dimension. Notes: This option is available for all widgets except for Table, Cross Table, Text, HTML, Image, and Sparkline. The ...Train Test Split
Train Test Split is located under Model Studio () under Sampling in Data Preparation, in the left task pane . Use the drag-and-drop method to use the algorithm in the canvas. Click the algorithm to view and select different properties for analysis. ...Train Test Split
Train Test Split is located under Model Studio ( ) under Sampling in Data Preparation, in the left task pane . Use the drag-and-drop method to use the algorithm in the canvas. Click the algorithm to view and select different properties for analysis. ...Train Test Split
Train Test Split is located under Forecasting ( ) in Data Preparation, in the left task pane. Use the drag-and-drop method to use the algorithm in the canvas. Click the algorithm to view and select different properties for analysis. Refer to ...Formatting Y-axis
This formatting allows you to change the various parameters associated with the Y-axis. The figure given below shows the available formatting options for Y-axis. The subsequent sections describe different fields present on Y-axis formatting.