Grid
Grid formatting option is available in widgets that contain Tables.
By default, the Grid formatting options are not visible. Turn the toggle button ON ( ) to use the Grid formatting options.
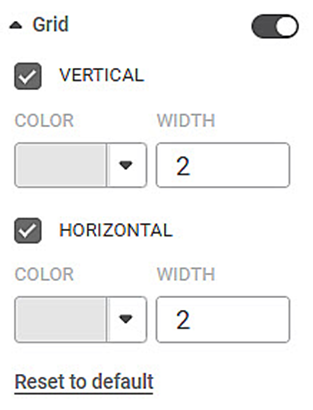
The table given below describes different fields present on Grid formatting.
Field | Description | Remark |
|---|---|---|
Vertical Color | Color of the column borders | — |
Vertical Width | Width of the column borders | — |
Horizontal Color | Color of the row borders | — |
Horizontal Width | Width of the row borders | — |
To use Grid formatting options, first plot a Table chart using the measures from the dataset. For example, we plot a Table Chart of Income.
The figure given below shows an original image of the Table Chart.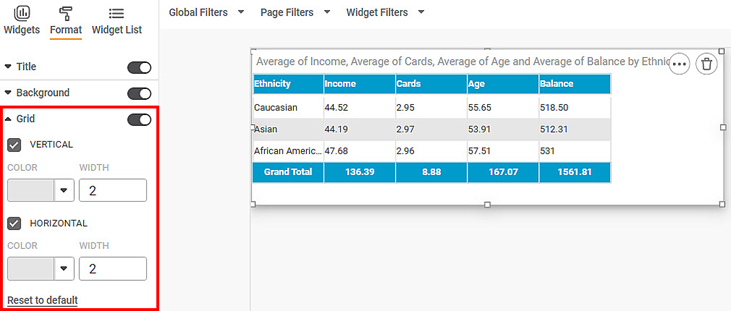
Now,
- Change the vertical grid color and width
- Change the vertical grid color and width
The resultant widget is shown below.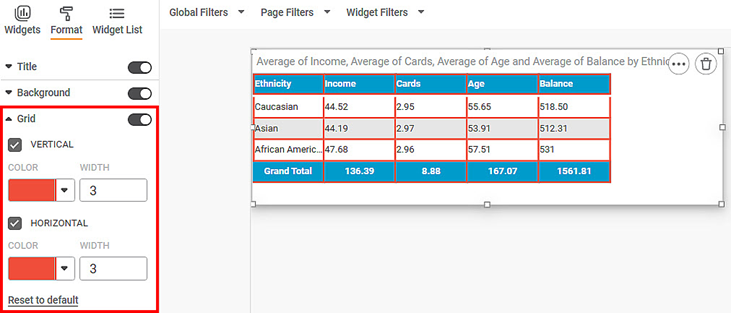
Related Articles
Canvas Grid Functionality
Grid support helps designers align and organize visuals precisely on the canvas using an underlying layout structure. Overview Grid is available for Rubisight Designers The grid is visible only in Edit Mode It helps in maintaining consistent spacing ...Grid Line
Gridlines are a crisscross mesh of lines drawn in the region between X and Y axes in a graph or chart. The table given below describes different fields present on Grid Line formatting on Y-axis. Field Description Remark Width It allows you to select ...Grid Line
Gridlines are a crisscross mesh of lines drawn in the region between X and Y axes in a graph or chart. The table given below describes different fields present on Grid Line formatting on X-axis. Field Description Remark Width It allows you to select ...Formatting a Table
This formatting applies to widgets that contain tables. For example, table formatting is possible for widgets such as Table and Cross Table. To format the chart, follow the steps given below. Create the number of charts as required. Refer to Creating ...Formatting the Axis
You can format the axes for charts that contain any one or both of the two axes, that is, the X-axis and Y-axis. It is possible only in charts where we have axial variables. To format the axis, follow the steps given below. Create the number of ...