Outliers
Note | This feature is only applicable to the boxplot widget. |
An outlier is an observation point that is distant from other observations. Outliers can significantly impact the results of statistical analysis and can occur for various reasons, including variability in the data, measurement error, or experimental error. The figure given below shows the different fields present in the Outliers formatting.
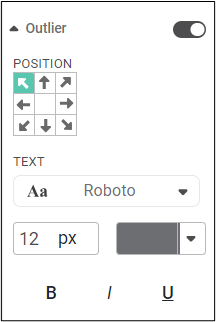
The table given below describes different fields present in Outliers formatting.
Field | Description | Remark |
Position | It allows you to select the location on the dashboard page where you want to position the outlier text. |
|
Text | It allows you to change the appearance of the outlier text. |
|
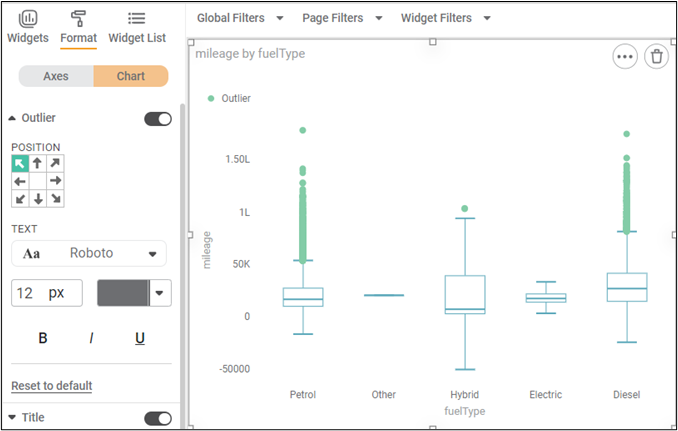
To use the outliers formatting option, first plot a boxplot chart using dimensions and measures from the dataset. For example, we plot a boxplot chart of mileage against fuelType.
The figure given below displays the Boxplot Chart.
By default,
- The Outlier label is located in the top-left corner.
- The font type is Roboto, the font size is 12, and the default color is used.
Now,
- Change the position of the Outlier label. In the chart below, we position it at the upper - center of the chart.
- Change the Outlier label font type, font size, and font color.
- Make it bold, italic, and underline it.
The resultant widget is shown below.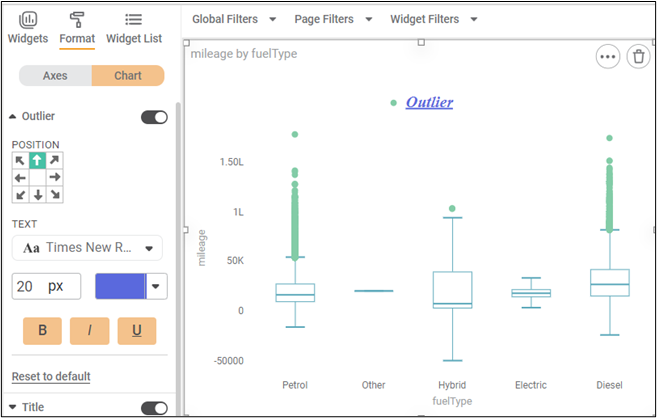
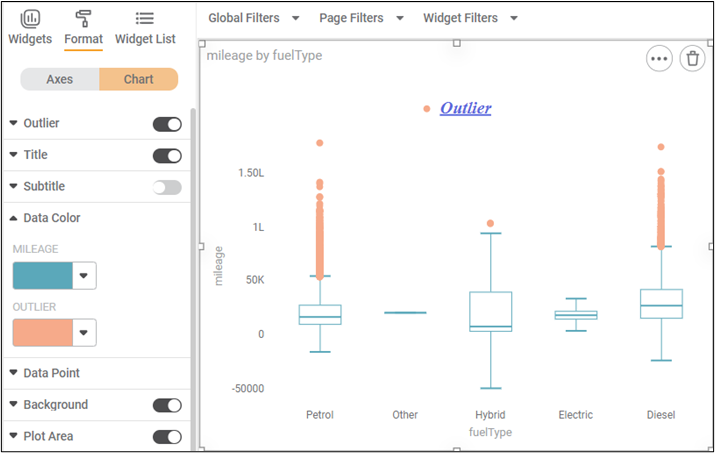
You can also change the color of the outlier points from Chart > Data Color > Outlier.
Related Articles
Outlier Detection
Outlier Detection is located under Model Studio in Data Preparation, in the task pane on the left. Use drag-and-drop method to use algorithm in the canvas. Click the algorithm to view and select different properties for analysis. Refer to Properties ...Outlier Detection
Outlier Detection is located under Model Studio ( ) in Data Preparation, in the task pane on the left. Use drag-and-drop method to use algorithm in the canvas. Click the algorithm to view and select different properties for analysis. Refer to ...Isolation Forest
Isolation Forest is located under Machine Learning () in Anomaly Detection, in the left task pane. Use the drag-and-drop method (or double-click on the node) to use the algorithm in the canvas. Click the algorithm to view and select different ...Local Outlier Factor
Local Outlier Factor is located under Machine Learning ( ) in Anomaly Detection, in the task pane on the left. Use the drag-and-drop method (or double-click on the node) to use the algorithm in the canvas. Click the algorithm to view and select ...One Class SVM
One Class SVM is located under Machine Learning ( ) in Anomaly Detection, in the left task pane. Use the drag-and-drop method to use the algorithm in the canvas. Click the algorithm to view and select different properties for analysis. Refer to ...