Region
The Region formatting option is available in Map chart.
To use the Region formatting options, first plot a Map chart.
For example, we plot a Map Chart of Population by Region.
The figure given below shows an original image of the Map Chart.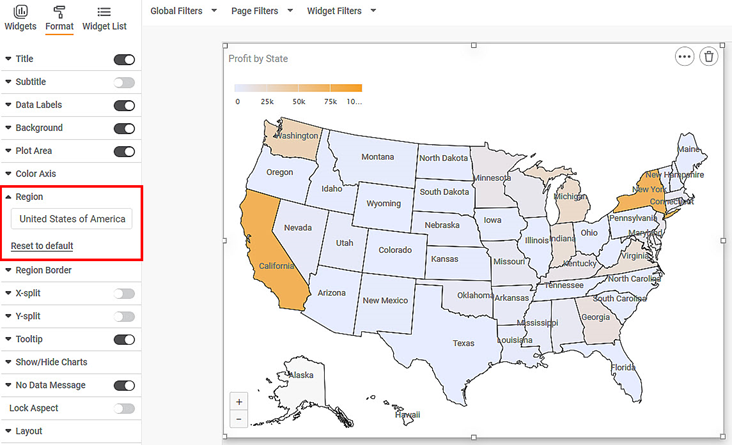
Now,
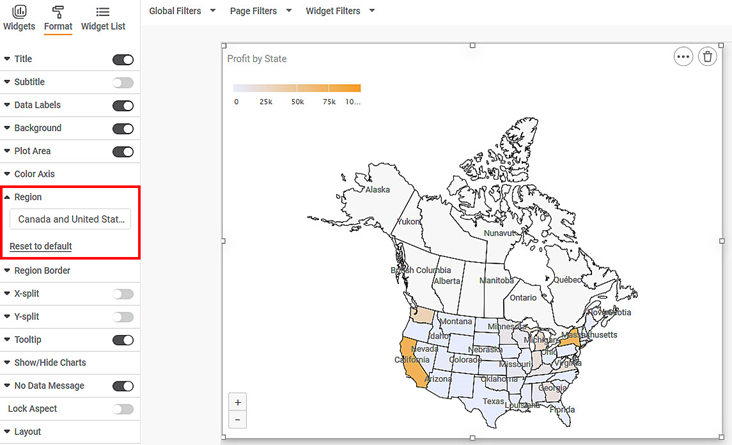
Select Region as Canada and United States of America.
The resultant widget is shown below.
Related Articles
Merge Same Values
The Merge same values option allows you to merge rows containing same values for the selected dimension. This option is available under Column option in Table, Cross Table, and Sparkline charts and is visible only after you select a column. Note: ...Show blank as zero
Showing blanks as zero in widgets Show Blank as Zero functionality allows you to represent Null values as zero in widgets. It is available in line chart, column chart, bar chart, stacked bar chart, stacked column chart and Combination chart. By ...Drill Through with Keep All Filters
Drill Through with Keep All Filters This option is available from Rubisight dashboard edit mode. This option is available in page format settings. This is used to carry forward all applicable filters on the respective chart which is drilled through. ...Creating a Map Widget
In RubiSight, you can create a map widget if your dataset contains geographical variables. Geographical Variable In RubiSight, a new variable type called geographical is added to represent a location. It is supported for the below-listed location ...Drill Through from Chart to Page with Context Filtering
Drill Through Filters (Page Level) Overview Drill Through Filter option is available at the page level in the Filter Pane and is accessible from Edit/View/Outer modes. It enables navigation from one widget to another page while passing contextual ...