Background
Background refers to the entire space in which the widget and its allied information, like title, legend, and subtitle, are located. By default, the background formatting options are not visible. Turn the toggle button ON ( ) to format the background.
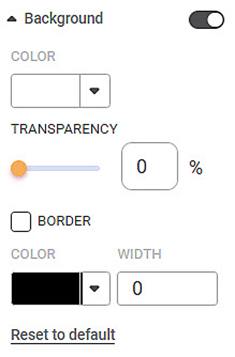
The table given below describes different fields present in Background formatting.
Field | Description | Remark |
|---|---|---|
Color | It allows you to change the color of the background. | By default, the color of the background is the same as the canvas on which the widget is plotted. |
| Transparency | It allows you to modify the transparency level. | By default, the transparency level is set to 0%. You can modify it to max 100%. |
Border Color | It allows you to select a color for the border given to the widget background. |
|
Border Width | It allows you to change the width of the border given to the region where the subtitle is displayed. |
To use Background formatting options, first plot a Column Chart using the dimensions and measures from the dataset. For example, we plot a Column Chart of the Count of Cards against Gender. The Ethnicity of the sample is the Legend dimension.
The figure given below shows an original image of the Column Chart. By default, there is no Background to the widget.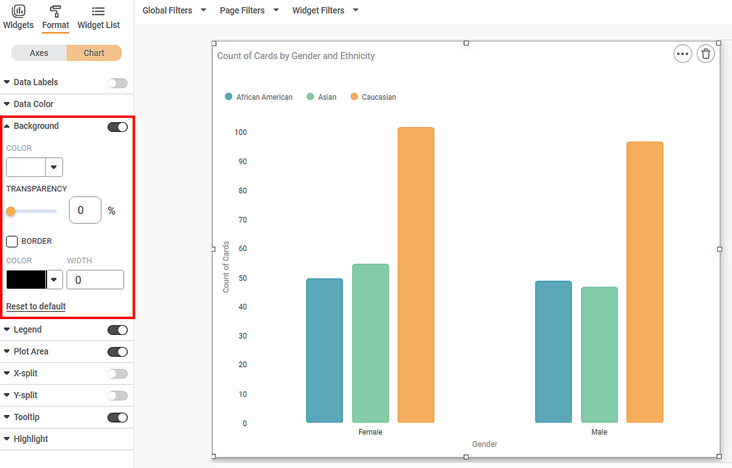
Now,
- Select a suitable background color for the widget.
- Give a suitable border to the background. Change its color and width.
The resultant widget is shown below.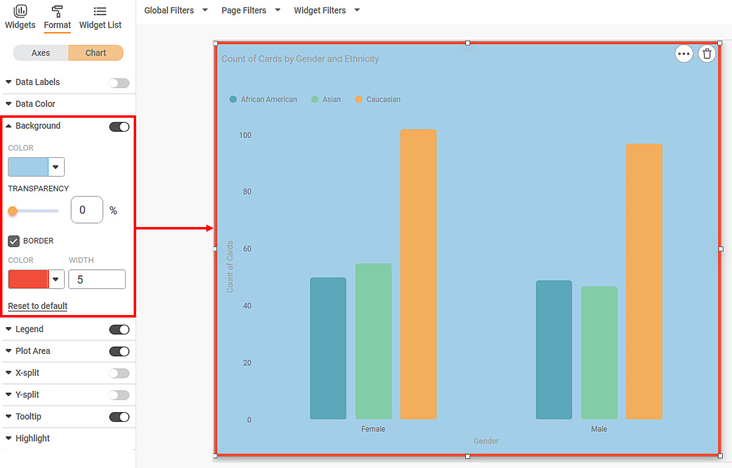
To use Background formatting options, plot a chart using the dimensions and measures from the dataset. For example, we plot a Column Chart of the Employee Count by Department. The Gender of the sample is the Legend dimension. Plot a different Pie chart using similar measures for demonstrating the Transparency feature.
The figure given below shows an original image of the Column and Pie Chart. By default, there is no Background to the widget.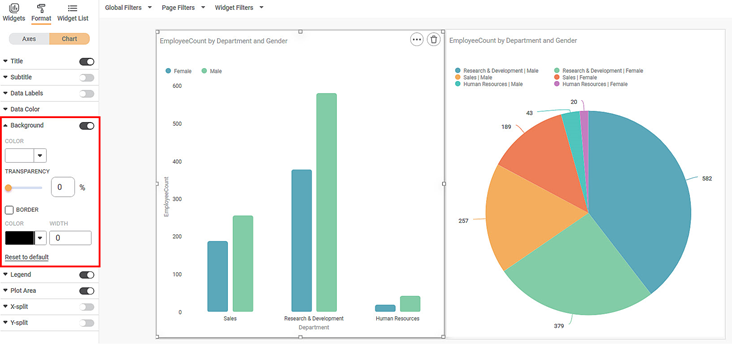
Now,
- Select a suitable background color for the widget.
- Give a suitable border to the background. Change its color and width.
The resultant widget is shown below.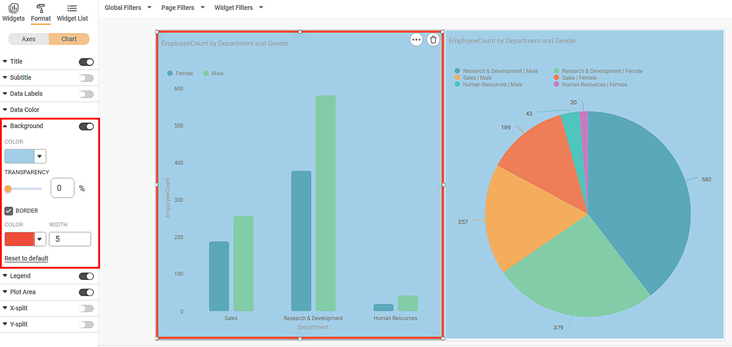
Now, for the bar graph make the transparency value 100%. Keep the Pie chart configuration as it is.
The resultant widget is shown below.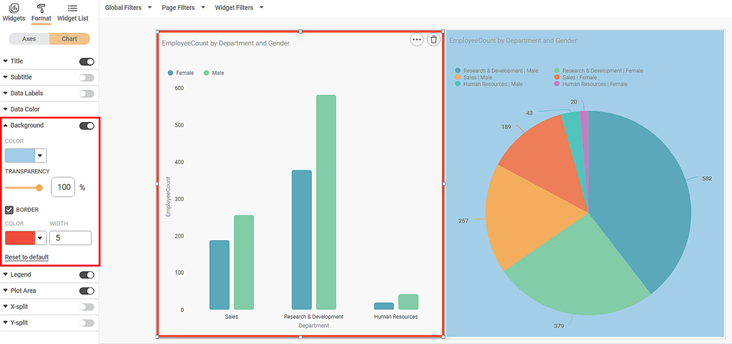
You can make out a difference. The Bar graph background appears as transparent.
Related Articles
Text Background
In RubiSight, three Background formatting options are available for Text Widget. Gradient Image Border The Gradient and Image formatting options can be applied independently. Border can be applied along with both, Gradient and Image. The Background ...Plot Area
The Plot Area refers to that part of the chart where the widget is plotted. For example, in a bar chart, the plot area lies between the X and Y axes. The table given below describes different fields present for Plot Area formatting. Field Description ...Grand Total
The Grand Total formatting option is available in the Cross Table widget. By default, the Grand Total formatting options are not visible. Turn the toggle button ON () to use the Grand Total formatting options. The table given below describes ...Values
Values formatting option is available in the Cross Table widget. The table given below describes different fields present on Values formatting. Field Description Remark Header Font It allows you to change the appearance of the Header row. You can ...Row
The Row formatting option appears under Cross Table. The table given below describes different fields present on Row formatting. Field Description Remark Header Font It allows you to change the appearance of the Header row. You can change the text ...