Grand Total
The Grand Total formatting option is available in the Cross Table widget.
By default, the Grand Total formatting options are not visible. Turn the toggle button ON (![]() ) to use the Grand Total formatting options.
) to use the Grand Total formatting options.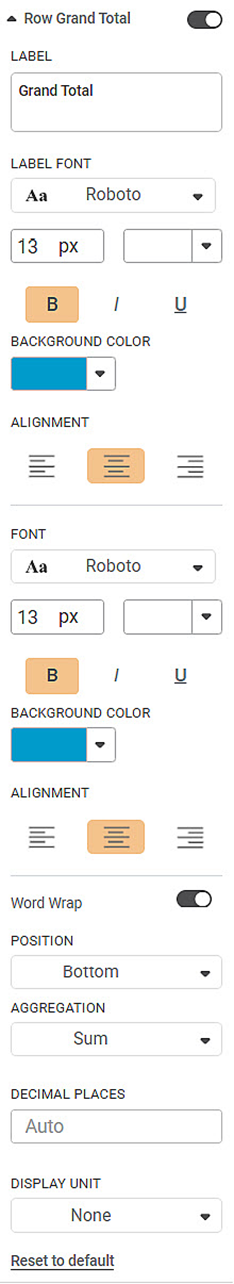
The table given below describes different fields present on Sub Total formatting.
Field | Description | Remark |
|---|---|---|
ROW GRAND TOTAL LABEL | It allows you to specify the label of the Grand Total row. | — |
LABEL FONT | It allows you to change the appearance of the Label. |
|
BACKGROUND COLOR | It allows you to change the background color of the label row. | — |
ALIGNMENT | It allows you to change the text alignment of the label row. | You can align the text to Left, Centre, or Right. |
FONT | It allows you to change the appearance of the Grand Total row. |
|
BACKGROUND COLOR | It allows you to change the background color of the Grand Total row. | — |
ALIGNMENT | It allows you to change the text alignment of the Grand Total row. | You can align the text to Left, Centre, or Right. |
To use the Grand Total formatting options, begin with plotting a Cross Table as shown in the figure below.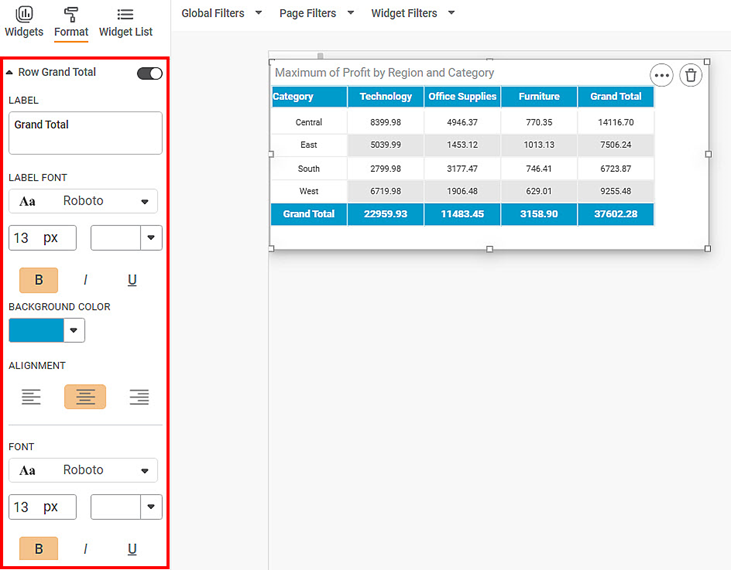
Now,
- Change the Grand Total Label Text.
- Change the Label Font
- Change the alignment, background color
- Change the font, alignment, background color of the grand total row
The resultant widget is shown below.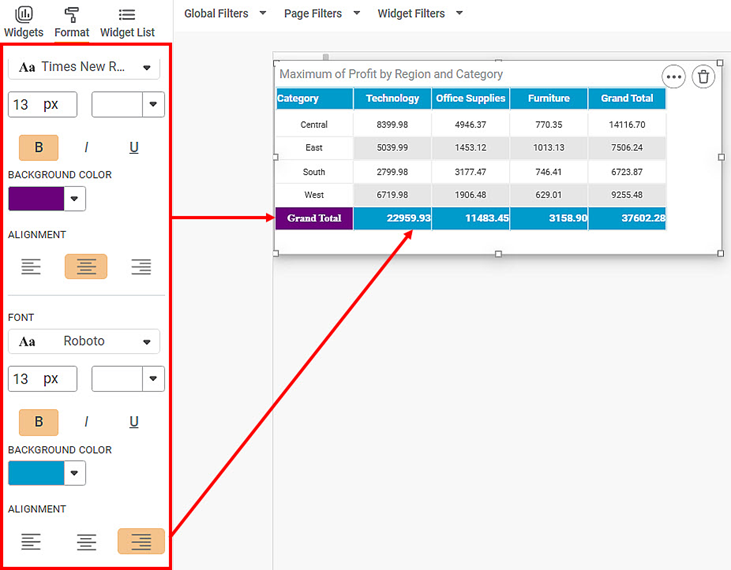
Related Articles
Support Advance Sort with Grand Total Column in Cross Table
Refer Advance Sort for configuring sorting on the widgets. Cross Table has additional configuration in Advance Sort, to add sorting condition based on the Column Grand Total. To understand the configurations, follow the below steps: 1. Plot cross ...Total And Sub-Totals
No table of figures entries was found.h1. Formatting a Table You can format the tables that appear in various charts. Tables can be plotted standalone like Table and Cross Table, or they accompany other charts (like Sparkline Chart in which they ...Total
The Total formatting option is available in the Table chart. The table given below describes different fields present on Total formatting. Field Description Remark Label It allows you to select the label you want to assign for the Total column. — ...Decimal Place Formatter
Formatting a Table You can format the tables that appear in various charts. Tables can be plotted standalone like Table and Cross Table, or they accompany other charts (like Sparkline Chart in which they accompany a Line, Area, or Column Chart). The ...Configuring Display Unit Mapping
Display Unit Mapping-Formatter To display chart labels/tooltip values/axis labels and such applicable values wherein the display unit is displayed, the formatter -Display Unit Mapping is available in the page level Format pane options. (To Navigate: ...