Date and Time Formatting on Chart
In RubiSight, when you plot a chart using the Date and Time formatting feature, the coordinates of the plot appear in the standard ISO format, by default, as given below.
Format: YYYY-MM-DD HH:MM:SS
Where,
YYYY-MM-DD is the date components of the coordinate
HH:MM:SS is the time component of the coordinate
For example, 2021-11-23 13:30:57.
|
|
You can customize the date and time components using the Label formatting options present under Formats in the Widget Pane.
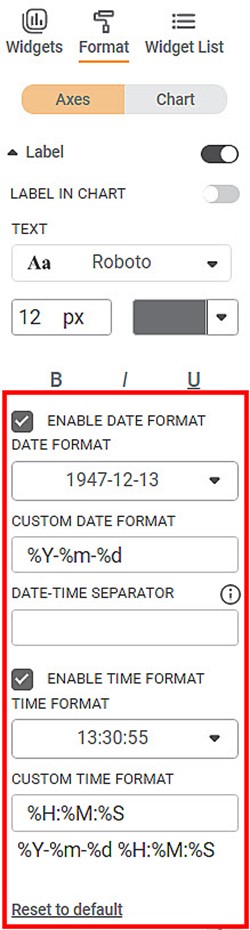
The different fields present on the Date and Time Formatting options under Label are given below.
Field | Description | Remark |
Enable Date Format | The checkbox allows you to enable/disable the Date Format. |
|
DATE FORMAT | The drop-down allows you to select the Date format from the system-defined formats. | — |
CUSTOM DATE FORMAT | It displays the Date format using directives and an interval designator for customized configuration. | — |
DATE-TIME SEPARATOR | It allows you to enter a separator to split the Date Format and Time Format. It also allows you to enter the separator T if your feature uses the ISO standard date and time format (YYYY-MM-DD HH:MM:SS). |
|
Enable Time Format | The check box allows you to enable/disable Time Format. |
|
TIME FORMAT | The drop-down allows you to select the Time format from the system-defined formats. | — |
CUSTOM TIME FORMAT | It displays the time format using directives and an interval designator for customized configuration. | — |
Format String | It displays the date/time format or data and time format and the separator, using directives and interval designator for customized configuration. |
|
Notes: |
|
The different system-defined Date and Time Formats in Rubiscape are given below.
Date Formats | |||
1947-12-13 | 12-13-1947 | 12-13-47 | 12.13.1947 |
12.13.47 | 12/13/1947 | 12/13/47 | 13-12-1947 |
13-12-47 | 13-Dec-1947 | 13-Dec-47 | 13-December-1947 |
13-December-47 | 13.12.1947 | 13.12.47 | 13.Dec.1947 |
13.Dec.47 | 13.December.1947 | 13.December.47 | 13/12/1947 |
13/12/47 | 13/Dec/1947 | 13/Dec/47 | 13/December/1947 |
13/December/47 | 1947-13-12 | 1947-13-Dec | 1947-13-December |
1947-Dec-13 | 1947-December-13 | 1947.12.13 | 1947.13.12 |
1947.13.Dec | 1947.13.December | 1947.Dec.13 | 1947.December.13 |
1947/12/13 | 1947/13/12 | 1947/13/Dec | 1947/13/December |
1947/Dec/13 | 1947/December/13 | 47-12-13 | 47-13-12 |
47-13-Dec | 47-13-December | 47-Dec-13 | 47-December-13 |
47.12.13 | 47.13.12 | 47.13.Dec | 47.13.December |
47.Dec.13 | 47.December.13 | 47/12/13 | 47/13/12 |
47/13/Dec | 47/13/December | 47/Dec/13 | 47/December/13 |
Dec-13-1947 | Dec-13-47 | Dec.13.1947 | Dec.13.47 |
Dec/13/1947 | Dec/13/47 | December-13-1947 | December-13-47 |
December.13.1947 | December.13.47 | December/13/1947 | December/13/47 |
Time Formats | |||
13:30:55 | 01:30 PM | 01:30:55 PM | 13:30 |
The different customized formats for Date and Time are given below.
Directive | Explanation | Example |
%a | Abbreviated weekday name | Sun, Mon, ..., Sat |
%A | Full weekday name | Sunday, Monday, ..., Saturday |
%w | Weekday as a decimal number | 0, 1, ..., 6 |
%d | Day of the month as a zero-padded decimal | 01, 02, ..., 31 |
%-d | Day of the month as a decimal number | 1, 2, ..., 30 |
%b | Abbreviated month name | Jan, Feb, ..., Dec |
%B | Full month name | January, February, ..., December |
%m | Month as a zero-padded decimal number | 01, 02, ..., 12 |
%-m | Month as a decimal number | 1, 2, ..., 12 |
%y | Year without century as a zero-padded decimal number | 00, 01, ..., 99 |
%-y | Year without century as a decimal number. | 0, 1, ..., 99 |
%Y | Year with century as a decimal number. | 2013, 2019, 2021, ... |
%H | Hour (24-hour clock) as a zero-padded decimal number | 00, 01, ..., 23 |
%-H | Hour (24-hour clock) as a decimal number | 0, 1, ..., 23 |
%I | Hour (12-hour clock) as a zero-padded decimal number | 01, 02, ..., 12 |
%-I | Hour (12-hour clock) as a decimal number | 1, 2, ... 12 |
%p | Locale’s AM or PM. | AM, PM |
%M | Minute as a zero-padded decimal number | 00, 01, ..., 59 |
%-M | Minute as a decimal number | 0, 1, ..., 59 |
%S | Second as a zero-padded decimal number | 00, 01, ..., 59 |
%-S | Second as a decimal number | 0, 1, ..., 59 |
%f | Microsecond as a decimal number, zero-padded on the left | 000000 to 999999 |
%z | UTC offset in the form +HHMM or -HHMM | +0530, -0530, ... |
%Z | Time zone name (abbreviation) | CST, IST, ... |
%j | Day of the year as a zero-padded decimal number | 001, 002, ..., 366 |
%-j | Day of the year as a decimal number | 1, 2, ..., 366 |
%U | Week number of the year (Sunday as the first day of the week). All days in a new year preceding the first Sunday are considered to be in week 0. | 00, 01, ..., 53 |
%W | Week number of the year (Monday as the first day of the week). All days in a new year preceding the first Monday are considered to be in week 0. | 00, 01, ..., 53 |
%c | Locale’s appropriate date and time representation | Mon Sep 30 07:06:05 2013 |
%x | Locale’s appropriate date representation | 09/30/13 |
%X | Locale’s appropriate time representation | 7:06:05 |
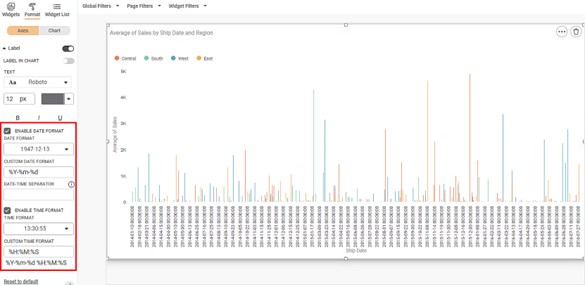
To use Date and Time formatting options on the chart, first plot a Column Chart using the dimensions and measures from the dataset. Refer to Figure: Date & Time Formatting Options under Label for date and time formats in the Label formatting options.
For example, we plot a Column Chart of the Average of Sales (on the Y-axis) against Ship Date (on the X-axis). The Ship Date feature contains only the date values.
The Region of the sample is the Legend dimension.
The figure given below shows an original image of the Column Chart. By default,
- The X-axis displays the date and time coordinates in the standard ISO format.
- The date values are displayed in YYYY-MM-DD format.
- The coordinates are displayed with time format as 00:00:00. For example, 2018-01-05T00:00:00
Scenario 1:
Now,
- Clear the Enable Time Format checkbox.
- Keep all other formatting options unchanged.
The resultant widget is shown below.
The X-axis displays only the date components of the values in YYYY-MM-DD format - for example, 2018-01-05.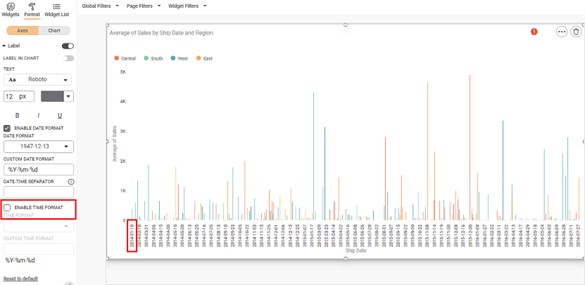
Scenario 2:
Now,
- Keep the selection of both the Enable Date Format and Enable Time Format checkboxes unchanged.
- Change the CUSTOM DATE FORMAT and CUSTOM TIME FORMAT as required. For example, the Date Format is changed to %m-%d, and the Time Format is changed to %H:%M.
The resultant widget is shown below.
The X-axis displays the date components of the values in MM-DD format and the time format as 00:00. For example, 12:28 00:00.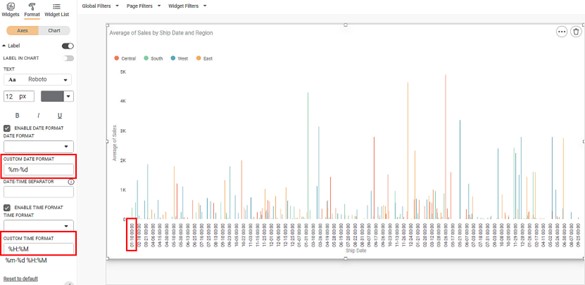
Related Articles
Card Chart Data Labels Datetime formatting
Card chart when plotted with Date/Interval column types with Minimum/Maximum aggregation shows the Minimum/Maximum date out of that column. Default date format is displayed in ISO format. The customization for datetime can be done using the available ...Formatting the Axis
You can format the axes for charts that contain any one or both of the two axes, that is, the X-axis and Y-axis. It is possible only in charts where we have axial variables. To format the axis, follow the steps given below. Create the number of ...Comma Format Options in Number Formatting
Overview Comma Format options allow users to display numbers based on region-specific digit grouping and separators. These options are available under the Comma Format dropdown and are enabled only when comma formatting is turned ON. Supported across ...Highlight Formatting for Solid Guage Chart
Before you walk through the below guide to set the Highlight on Solid Guage chart, you can refer Highlight for getting more details of the Highlight option to set the conditional formatting on the chart. For Solid Guage chart, to set the Conditional ...Contextual Data Tooltips
Tooltip configuration allows you to display additional information from the source dataset that is not directly plotted on the chart. This enhances data visibility by providing contextual insights when users hover over chart elements. Overview ...