Exploring a Workbook
After successful execution of the workbook or of an individual node in the workbook, you can explore the result of the node.
To explore the result of a node, follow the steps given below.
- Create a workbook or Open an existing workbook. Refer to Creating a Workbook or Opening a Workbook.
- Build your algorithm flow. Refer to Building Algorithm Flow in a Workbook Canvas.
- Run the workbook or run the required node (Reader or Task) on which you want to create the visualization.
- Select a Reader node or a Task node that has executed successfully and click the vertical ellipsis (
 ).
).
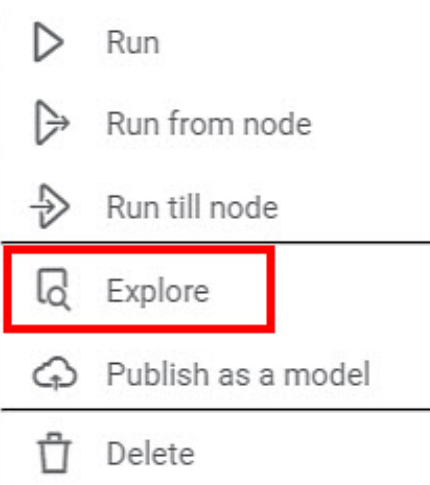
The options are displayed. Click Explore.
The output of the node is displayed as shown in the figure below.Note:
In this example, we have explored the output of the XGBoost algorithm. The content of the Result tab is different for different types of nodes.
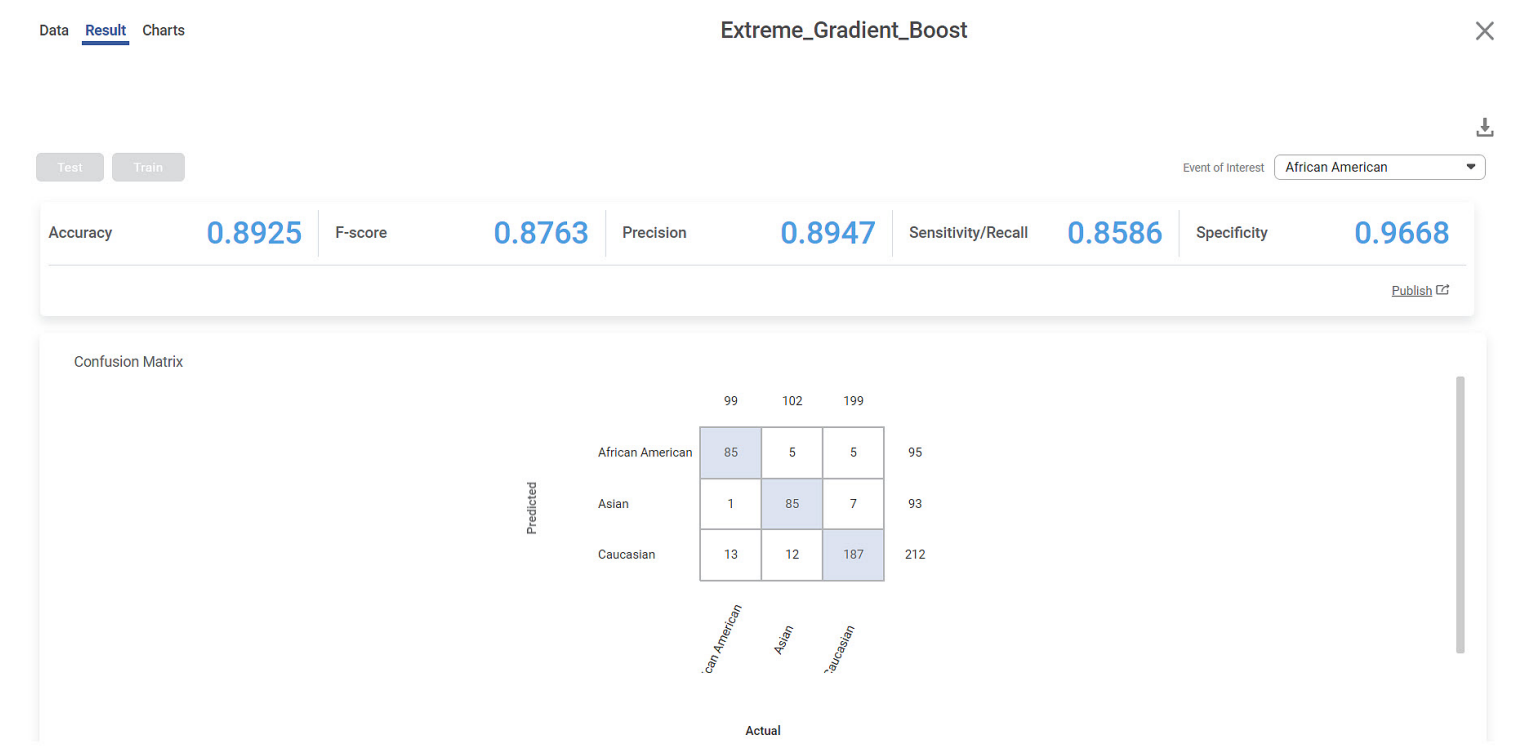 As seen in the above figure, there are three tabs in the top left corner –
- Data – It displays data specific to the selected node.
- Result – It displays the output of a node. If the node is a machine learning algorithm, statistical analysis, data preparation, or any such algorithms, it displays various statistics. It is blank in the case of a Reader node.
- Charts – It helps you to plot different charts using the results of the node. The following section explains in chart configuration detail.
Configuring Charts from Workbook
Rubiscape provides a function to plot graphs from within a workbook without switching to RubiSight. It is an extension of RubiSight provided in RubiStudio.
You can create visualizations on a Reader node or a Task node after they are successfully executed. Then, the result of the node can be used to plot graphs.
To configure charts from a workbook, follow the steps given below.
- Follow steps 1 to 3 of Exploring Workbook.
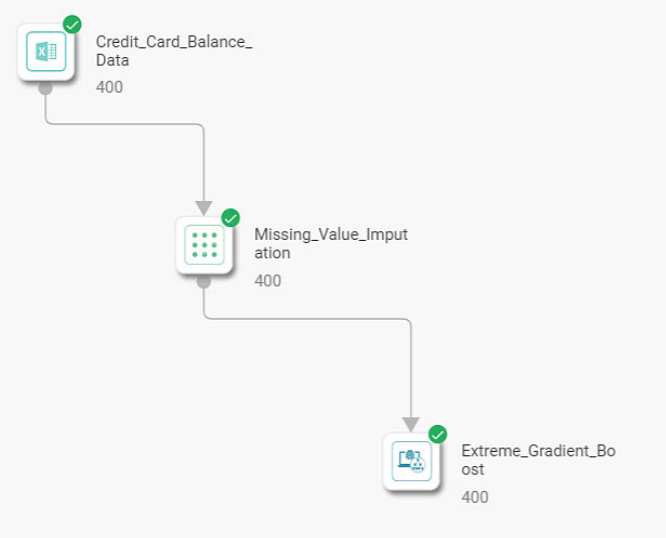
A sample algorithm flow after successful execution is displayed in the figure below.
- Select the required node, click the vertical ellipsis ( ) and click Explore.
The Result tab of the output is displayed.
- Click Charts.
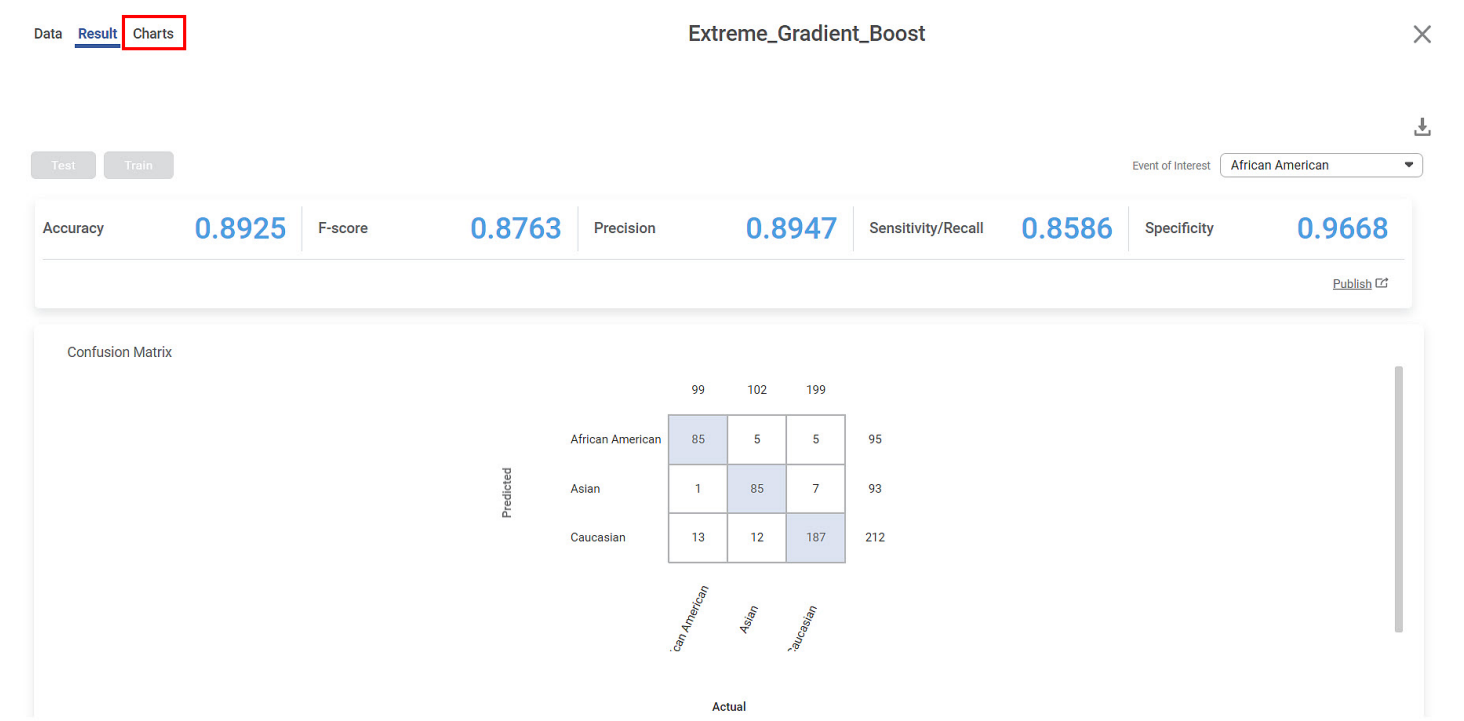
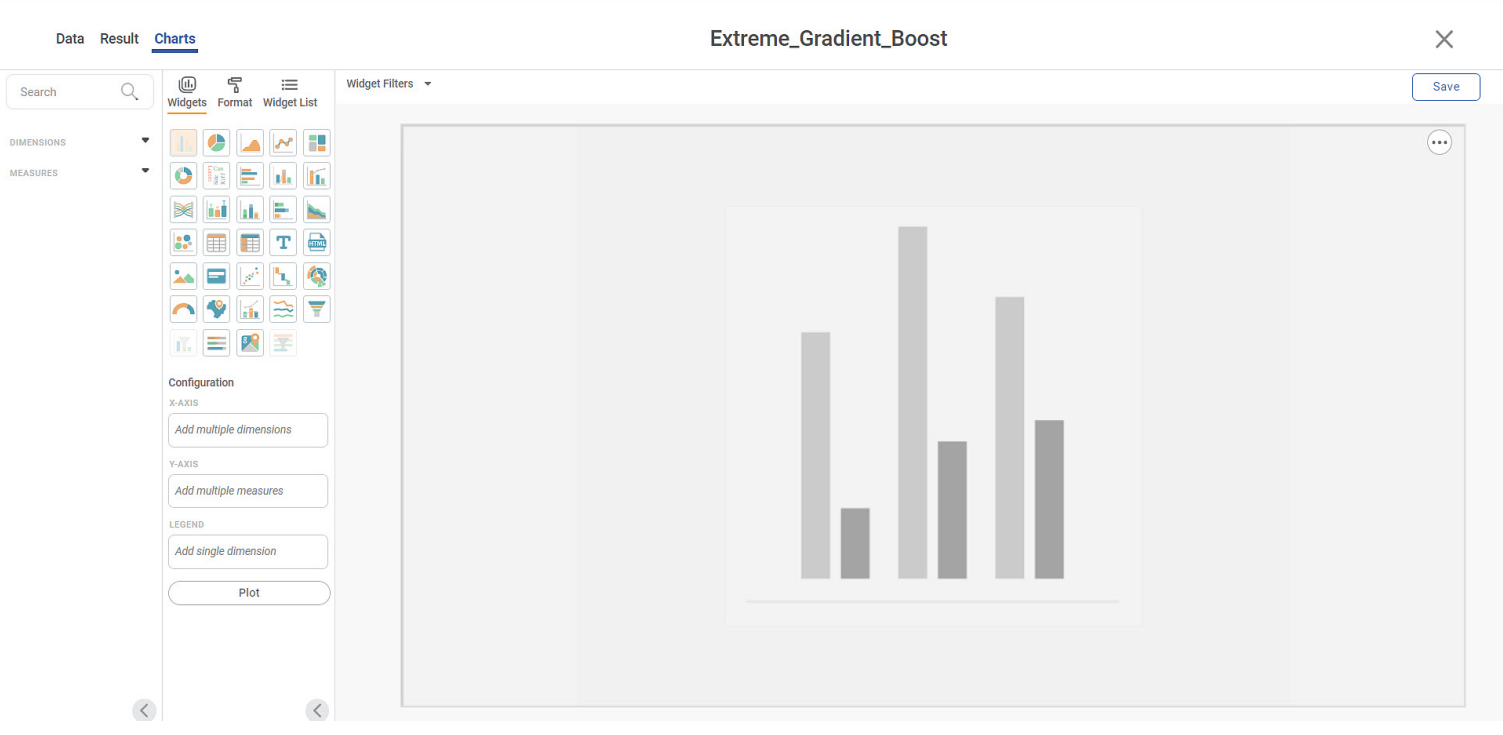
The Chart Configuration page is displayed.

Next, we plot a chart using the widgets available.
Note:
The default selected widget is Column Chart. You can select any of the available widgets.
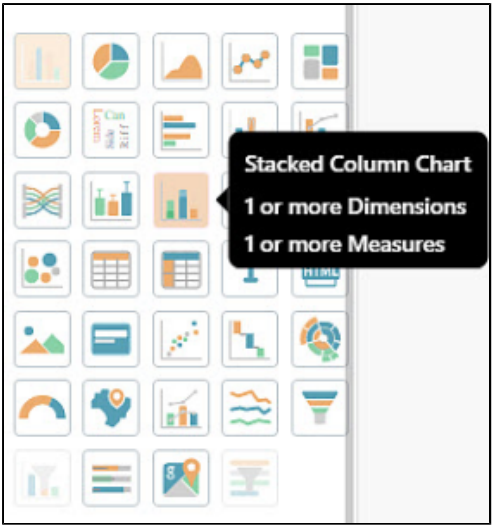
- In the WIDGETS pane, click the widget you want to plot. For example, here we consider a Stacked Column Chart.
The selected widget is added to the canvas. The Configuration settings for the selected widget are displayed at the bottom of the WIDGETS pane, as shown in the figure below.
- From the DATA pane to the left of the Widgets pane, drag-and-drop or select the DIMENSIONS and MEASURES in the appropriate Configuration.
For example, we moved Student in X-Axis, Balance in Y-Axis, and Ethnicity in Legend. - Click Plot.
The chart is plotted depending upon the dimensions and measures added in the configuration.
The sample graph with selected fields is shown in the figure below.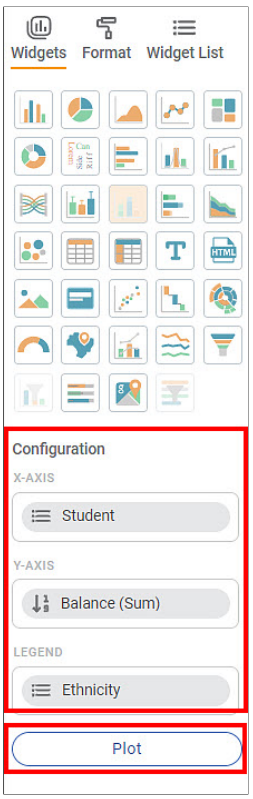
Notes: |
|
Related Articles
Exploring Datasets in RubiSight
Exploring datasets gives you an idea about the various data types present and the widgets that can be used to plot them. To explore a dataset, follow the steps given below. Open the Dashboard in edit mode. Refer to Editing a Dashboard. The Dashboard ...Exploring a Dataset
You can explore the existing dataset or the dataset that you have added or imported. For adding and importing a dataset, refer to Adding a Dataset or Importing a Dataset. Exploring the dataset shows you the information present in the selected ...Searching Workbook
You can search for a workbook by its name. It is especially helpful when the workbook list is long. Note: Make sure you are in the correct Workspace, which includes the Workbook that you want to search. To search a project, follow the steps given ...Workbook Validation
In Rubiscape, you can drag-and-drop algorithms and datasets on the workbook or workflow canvas to build a model. When you run the model, Rubiscape validates it before execution. The validation feature is used to notify the validation errors that ...Workbook Validation
In Rubiscape, you can drag-and-drop algorithms and datasets on the workbook or workflow canvas to build a model. When you run the model, Rubiscape validates it before execution. The validation feature is used to notify the validation errors that ...