Total
The Total formatting option is available in the Table chart.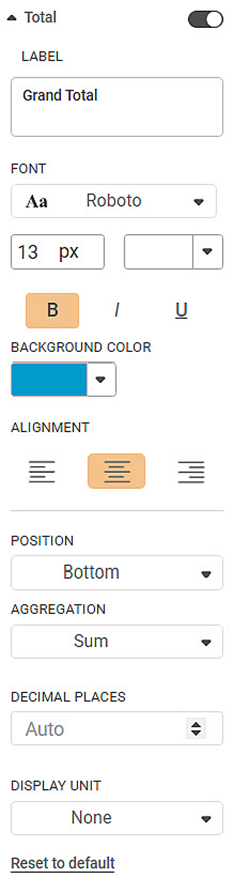
The table given below describes different fields present on Total formatting.
Field | Description | Remark |
|---|---|---|
Label | It allows you to select the label you want to assign for the Total column. | — |
Font | It allows you to change the appearance of the data label. |
|
Background Color | It allows you to change the background of the region where the title is displayed. | By default, the color is white. |
Alignment | It allows you to select the text alignment. | The options are Left, Right, and Center. |
To use Total formatting options, first plot a Table chart using the measures from the dataset. For example, we plot a Table Chart of Income.
The figure given below shows an original image of the Table Chart.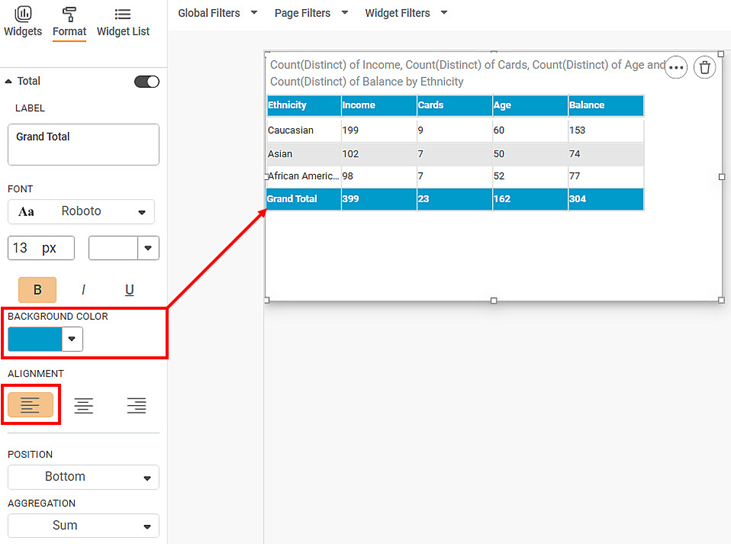
Now,
- Change the Label text, font type, font size, and font color.
- Make the text bold, italic, and underline it.
- Change the text alignment.
- Change the Background color.
- Change the border color and width.
The resultant widget is shown below.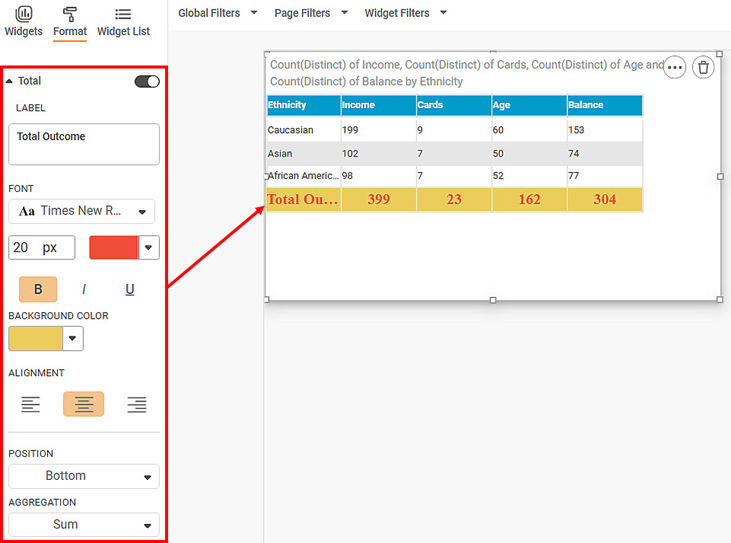
Related Articles
Grand Total
The Grand Total formatting option is available in the Cross Table widget. By default, the Grand Total formatting options are not visible. Turn the toggle button ON () to use the Grand Total formatting options. The table given below describes ...Total And Sub-Totals
No table of figures entries was found.h1. Formatting a Table You can format the tables that appear in various charts. Tables can be plotted standalone like Table and Cross Table, or they accompany other charts (like Sparkline Chart in which they ...Support Advance Sort with Grand Total Column in Cross Table
Refer Advance Sort for configuring sorting on the widgets. Cross Table has additional configuration in Advance Sort, to add sorting condition based on the Column Grand Total. To understand the configurations, follow the below steps: 1. Plot cross ...Percentage Calculations
For widgets like pie charts and donut charts, it is sometimes required to display the values as a percentage of the share of each section in the total share. For this, Rubiscape provides a Percentage functionality alongside the Aggregation methods to ...Decimal Place Formatter
Formatting a Table You can format the tables that appear in various charts. Tables can be plotted standalone like Table and Cross Table, or they accompany other charts (like Sparkline Chart in which they accompany a Line, Area, or Column Chart). The ...