Layout
Layout refers to the dimensions of that portion of the canvas on which the Chart is plotted. These dimensions can be changed and adjusted as required. Here, the canvas size remains the same.
The Layout formatting option is available in the Chart formatting options in all the widgets.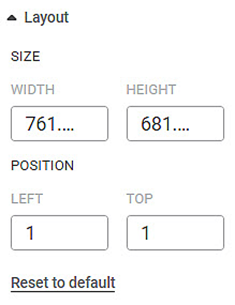
The table given below describes different fields present on Layout formatting.
Field | Description | Remark |
|---|---|---|
Width | It allows you to change the width of the layout. | — |
Height | It allows you to change the height of the layout. | — |
Left | It allows you to change the left margin of the layout. | — |
Top | It allows you to change the top margin of the layout. | — |
To use Layout formatting options, first plot any chart using the measures from the dataset.
For example, we plot a Bar Chart of Income against Gender.
The figure given below displays an original image of the Chart with default Layout options. By default, the width and height are 380 and 320 respectively.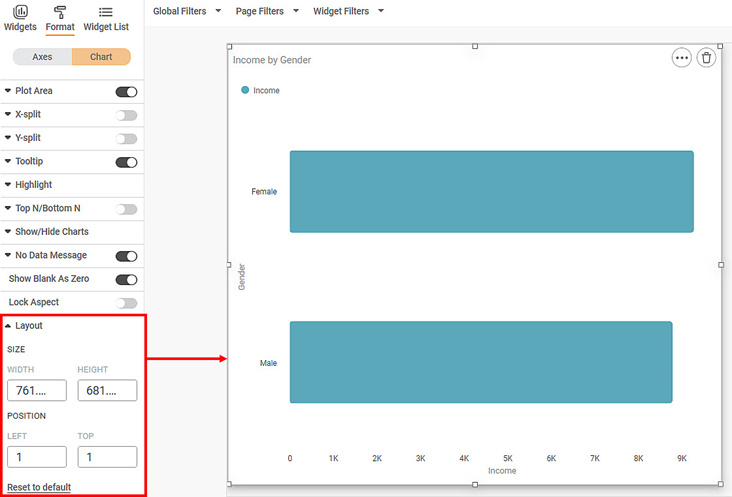
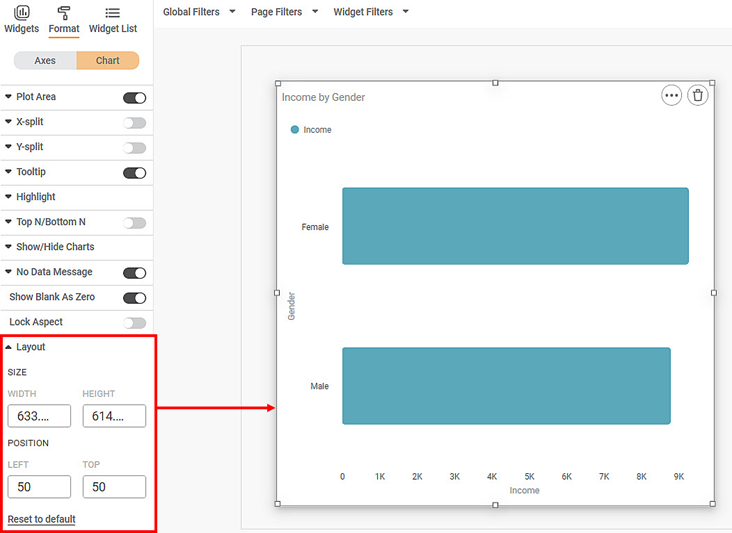
Now, change the Layout size and position formatting options. For example, in the chart below, we change the width and height to 600 and 500 respectively and the left and top position to 50. The chart is resized accordingly.
The resultant widget is shown below.
Related Articles
Layout
When you plot a widget, the widget appears on the dashboard canvas within a page with default dimensions. The width and height of the page within the boundaries of the dashboard canvas define the Page Type. You can view the Page Type under Page Size ...Stepped Layout
In RubiSight, you can plot a Cross Table using multiple features from the dataset. A Cross Table contains the following configuration options. Rows Columns Values The Stepped Layout option is available under Row in Cross Table formatting options. ...Introduction to Mobile View
Refer Navigate Mobile View to access the Mobile View. To ensure your dashboard is displayed correctly in the RubiSight Mobile Application, you need to configure the Mobile View. Charts can be organized in any desired layout, independent of the layout ...Configuring Dashboard from Mobile View
Refer Navigate Mobile View to access the Mobile View. Refer Mobile View introduction for getting details of the sections available in the Mobile View and why this configuration is required. Navigate to Mobile View of canvas for configuring dashboard ...Formatting a Table
This formatting applies to widgets that contain tables. For example, table formatting is possible for widgets such as Table and Cross Table. To format the chart, follow the steps given below. Create the number of charts as required. Refer to Creating ...