Top N Bottom N in Legend Configured Charts
To understand Top N Bottom N
formatter, refer – Top N
Bottom N.
For legend configured charts like
Column Chart, Bar Chart, Line Chart, etc., Top N Bottom N works in following
way:
Consider Column and Line charts
with configuration as below:
Consider Column and Line charts with configuration as below:
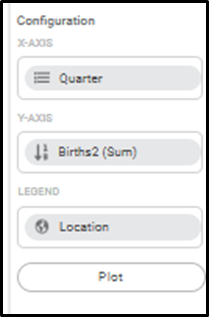
Column Chart Configuration:
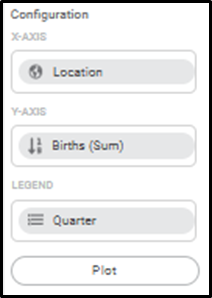
Line Chart Configuration:
The charts show data on the
charts as below:
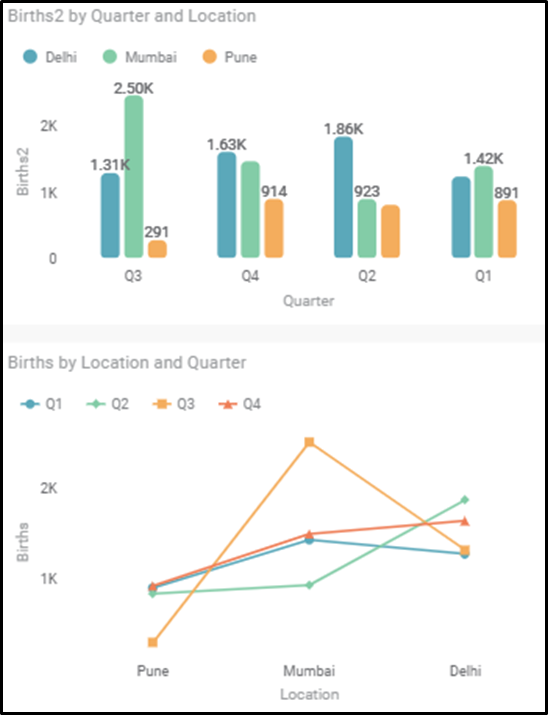
The charts are configured with
Legend configuration, showing legends for Location and Quarter columns
respectively.
To configure top 3 configuration
on the chart Top N configuration is set in the Column chart formatters as
below:
Thus, the Top 3 categories (with
Births -Sum by Quarter) – Q3, Q4 and Q2 are displayed with all its legend
values and the chart is displayed as below:
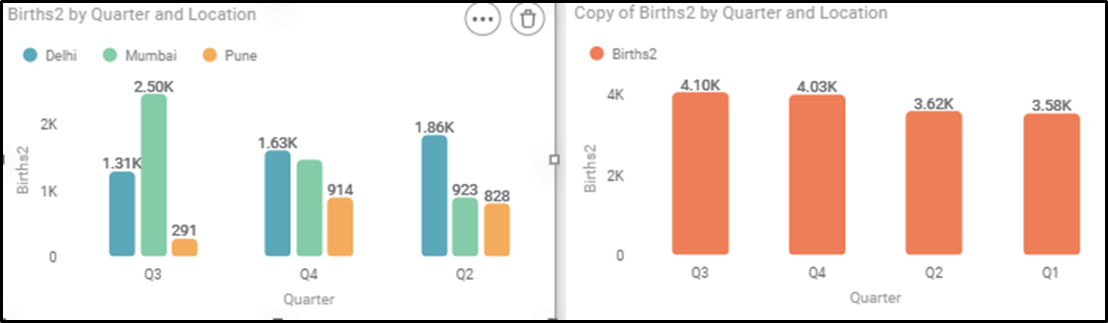
Right side chart shows the Sum of
Births by Quarter and on chart, the Top values for Sum by Births are Q3, Q4,
Q2. Same are considered while showing the Top 3 values when configured with
Legends.
Line Chart, configured for Bottom
2 configuration in Top N Bottom N formatter shows the values as below:
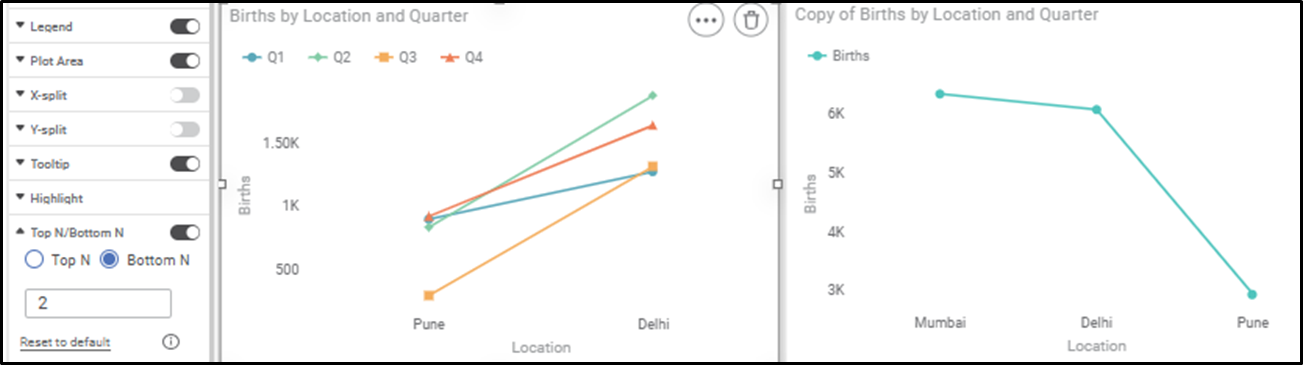
The right-side chart shows the
Bottom 2 values -Pune, Delhi. The same values are displayed on the Legend
configured chart showing their respective Legend values of Quarters.
Related Articles
Top N Bottom N
The Top N/Bottom N refers to the top (highest/largest) N values and bottom (lowest/smallest) N values or ranks in the aggregated values of the selected measure in the dataset. For example, if N = 15, then corresponding to a particular variable, we ...Legend
A legend (in a chart or graph) shows the kind of data represented by the chart. Legends give the explanation of the markings, symbols, colors, and characters on a chart or graph. The figure given below shows the various fields present in the Legend ...Data Labels in Pie and Donut Charts
Refer Data labels for using general formatting options for the charts. Along with these options, Pie and Donut charts are provided with additional formatting options. The below options are available with their respective formatting options- Figure 1: ...Generate and Plot Charts
Generate and Plot Charts RubiAI lets you generate the chart based on user prompts and also enables user to plot the chart in the Rubisight dashboard. Generate and plot option is available from Edit mode of the dashboard. From view mode user can ...Scrollbar Support in Charts
Scrollbar support allows users to handle large datasets and crowded visuals by enabling horizontal or vertical scrolling on charts. This ensures better readability and avoids overlapping of data points and labels. Overview Enables scrolling on X-axis ...