Understanding Project Display Pane
The project display pane displays the projects created in the selected workspace.
You can perform the list of actions as mentioned below. Visit the respective section for more information.
To view the project display pane. Follow the step given below.
- On the home page, click Projects.
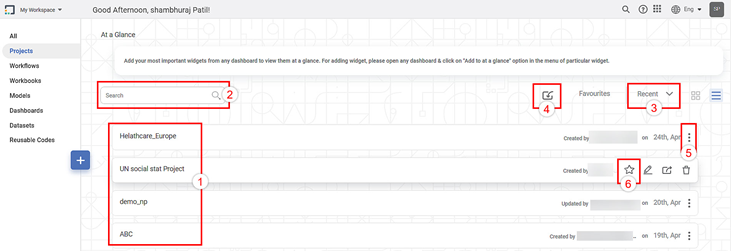
The table given below describes the fields and icons present on the project display pane.
Ref. No. | Description | Remark |
|---|---|---|
1. | It displays the list of recently created projects for the selected workspace. | The recently created or updated project is shown first in the list. It displays the name of the person who has updated the project along with the date when it is updated. |
2. | It allows you to search the required project. | You can search your project by typing text in this field. Partial text is also allowed. Refer to Searching a Project. |
3. | It allows you to sort projects. | The projects can be sorted as recently created/updated order or alphabetical order. |
4. | It allows you to import project | A project can be imported in a .DAT file format only. To import a project, refer to Importing a Project. |
5. | It allows you to perform Edit, Export, Delete actions. | Click the ellipsis to perform the required action. |
6. | It allows you to add the project as favorite. |
|
Related Articles
Understanding the Application Home Page
Your home page is the default workspace assigned to you as a user. The home page has four panes and a quick tour icon, as given below. Title pane: This pane displays options to go to the home page and change the workspace. It also displays options to ...Configuring Display Unit Mapping
Display Unit Mapping-Formatter To display chart labels/tooltip values/axis labels and such applicable values wherein the display unit is displayed, the formatter -Display Unit Mapping is available in the page level Format pane options. (To Navigate: ...Understanding the Workbook Canvas
The workbook canvas is the area where you can build algorithm flows. When you open a new workbook, the following icons and fields are displayed. The workbook screen has four panes, as given below. Task Pane: This pane displays the datasets and ...Understanding WorkFlow Canvas
The workflow canvas is the area where you can build algorithm flows. When you open a workflow, the following icons and fields are displayed. The workflow screen has four panes as given below. Task Pane: This pane displays the datasets and algorithms ...Understanding RubiSight Home Page
RubiSight home page is the area where you create data visualization using charts and graphs. When you create a new dashboard, the following icons and fields are displayed. The dashboard screen has four panes, as given below. Data Pane: This pane ...