Viewing a Dashboard
Viewing helps you open the dashboard and see all the charts, graphs, and tables in the view mode.
Notes: | Make sure you are in the correct Workspace, which includes the Dashboard that you want to view. |
To view a dashboard, follow the steps given below.
- Open the Workspace that includes your dashboard. Refer to Changing Workspace.
- On the home page, click Dashboards. Recent Dashboards for the selected workspace are displayed.
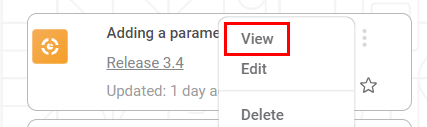
- Hover over the dashboard you want to view, click the vertical ellipsis, and then click View. The dashboard is displayed in view mode.
|
|
Related Articles
Adding Comments to a Dashboard
Adding comments to a dashboard helps you store important explanations about it and convey your message and information regarding the dashboard to other users. You can add comments to a dashboard in both the View Mode and the Edit Mode. To add ...Page Navigation On Same Dashboard
Suppose you are viewing a particular page of the dashboard. For a widget on that page, there is a reference to another page in the same dashboard. In this case, you can create and give a hyperlink of that page on the current page. When you click the ...Viewing Log In Workbook
Rubiscape generates a log of the tasks performed in the background when you run an algorithm. The log shows task name, type, duration, and status. The logs and activity trace are particularly helpful for troubleshooting. It also displays the custom ...Access Modes of Dashboard and Navigate Page or Filtering based on URL (Hyperlink)
When a Dashboard is published, all its pages are published by default in the same sequence they were created. When the Dashboard is published, you can create a Dashboard Link, which can be shared with business users. When the business users click the ...Configuring Dashboard from Mobile View
Refer Navigate Mobile View to access the Mobile View. Refer Mobile View introduction for getting details of the sections available in the Mobile View and why this configuration is required. Navigate to Mobile View of canvas for configuring dashboard ...