Viewing Log In Workbook
Rubiscape generates a log of the tasks performed in the background when you run an algorithm. The log shows task name, type, duration, and status. The logs and activity trace are particularly helpful for troubleshooting. It also displays the custom component log for the code fusion nodes. To view the log, follow the steps given below.
- Open a Workbook. Refer to Opening a Workbook.
- Click the Run icon (
 ) located in the top-right corner of the function pane. The workbook execution starts.
 - During the execution or after completion, click View Log. The summary of Log, Trace, and Custom Component Log is displayed.
Log:
It displays the details such as Task Name, Type, Status, and Row Count for any node.
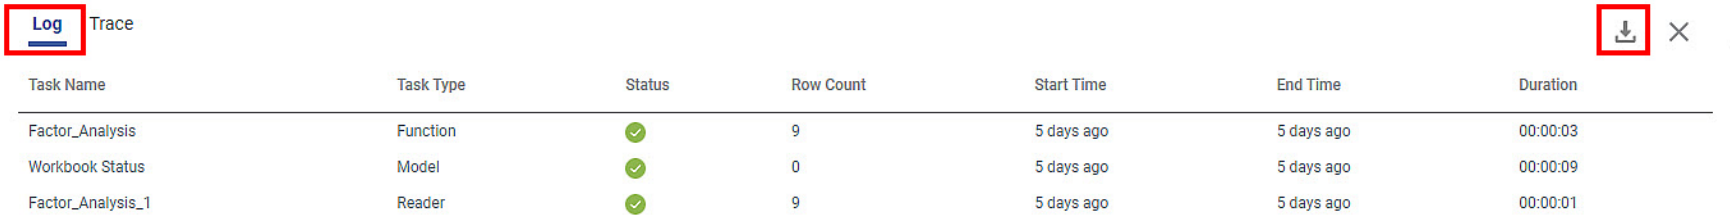
Click the download icon ( ) to download the Log summary as a CSV file.
Trace:
It displays the details of execution for any node. You can track the error if your execution fails.
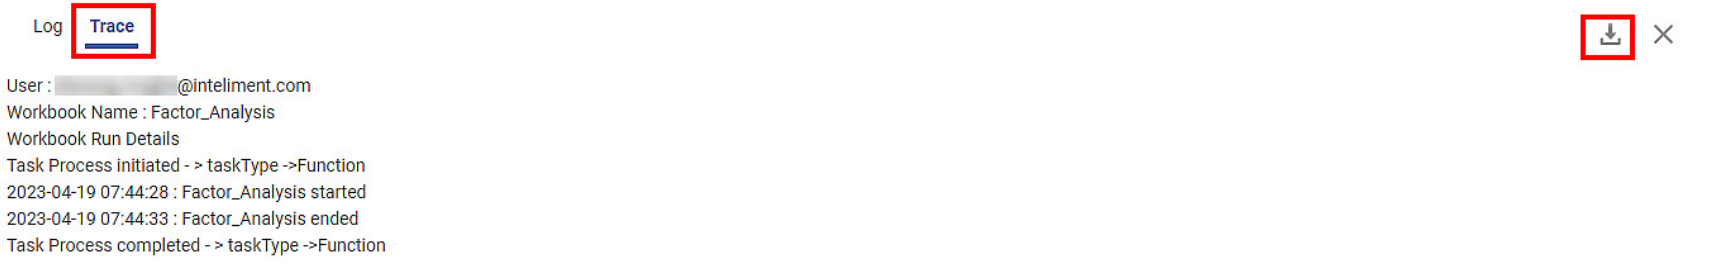
Click the download icon ( ) to download the Log summary as a Text file.
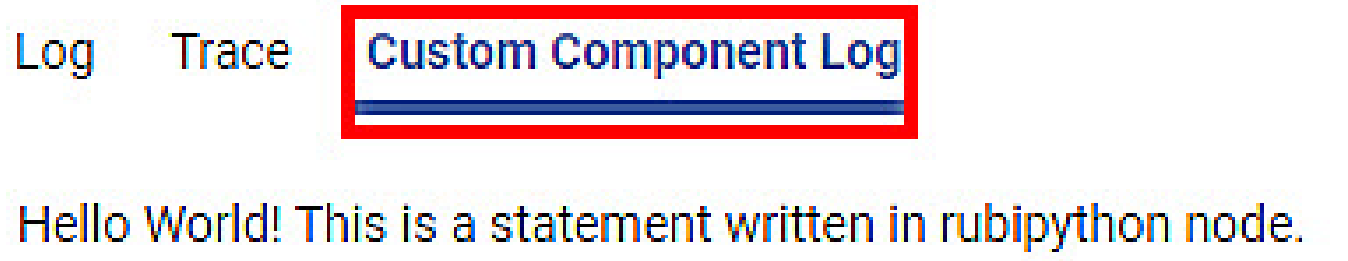
Custom Component Log:
It displays the printable code written only in the print2log command. It is visible only for the RubiPython node.
For example, we write the following statement in the RubiPython code editor.

In the Custom Component Log, you see the same statement printed as the summary.
Click the download icon ( ) to download the Log summary as a Text file.
Notes: |
|
Related Articles
Viewing Logs in Workbook in Forecasting
Rubiscape generates a log of all the tasks performed in the background when running an algorithm. The log shows task name, task type, status, row count, start and end time, and duration. The logs and activity trace are particularly helpful for ...Running a Workbook in Forecasting
You can run the existing workbook from the Card View or the Workbook Canvas. Note: After running the workbook, check the logs for more details about execution. Refer to Viewing Log in Workbook. Running from Card View To run a workbook from card view, ...Viewing Logs in Workflow
When you run an algorithm, rubiscape generates a log of the tasks that are performed in the background. The log shows task name, type, duration, and status. The logs and activity trace are particularly helpful for troubleshooting. To view the log, ...View Log Screen Enhancement
1. Introduction The View Log screen enhancement provides improved filtering, sorting, and workflow-specific visibility within the log panel. These improvements enable users to efficiently analyze workflow and node-level execution details. 2. Feature ...Running a Workbook
You can run an existing workbook. You can run a workbook either from Card View or from Workbook Canvas. Note: After you have run the workbook, check the logs for more information about execution details. Refer to Viewing Logs in Workbook. Running ...