Viewing Logs in Workbook in Forecasting
Rubiscape generates a log of all the tasks performed in the background when running an algorithm. The log shows task name, task type, status, row count, start and end time, and duration. The logs and activity trace are particularly helpful for troubleshooting. To view the log, follow the steps given below.
- Open a Workbook. Refer to Opening a Workbook.
- Click the Run icon (
 ) located in the top-right corner on the function pane. The workbook execution starts.
 - During the execution or after completion, click View Log. Logs are displayed as shown in the figure below.
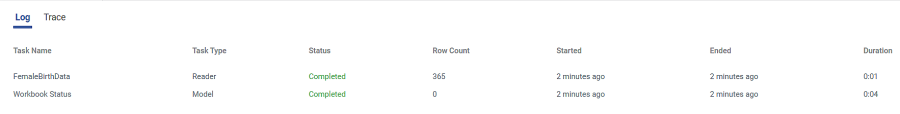
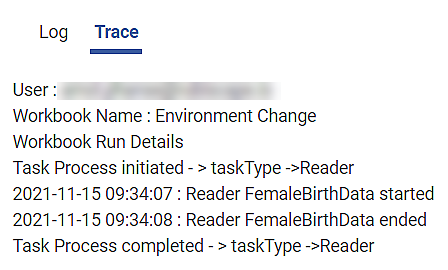
The log status can have one of these values: Yet to Start, Running, Completed, and Failed. - Click Trace.
The execution details are displayed. The log trace shows more details such as the username, workbook name, and timestamp of each activity. You can track the error if your execution fails.
Related Articles
Running a Workbook in Forecasting
You can run the existing workbook from the Card View or the Workbook Canvas. Note: After running the workbook, check the logs for more details about execution. Refer to Viewing Log in Workbook. Running from Card View To run a workbook from card view, ...Viewing Logs in Workflow
When you run an algorithm, rubiscape generates a log of the tasks that are performed in the background. The log shows task name, type, duration, and status. The logs and activity trace are particularly helpful for troubleshooting. To view the log, ...Viewing Log In Workbook
Rubiscape generates a log of the tasks performed in the background when you run an algorithm. The log shows task name, type, duration, and status. The logs and activity trace are particularly helpful for troubleshooting. It also displays the custom ...Understanding the Forecasting Workbook Canvas
The workbook canvas is the area where you can build algorithm flows. When you open a workbook, the following icons and fields are displayed. The workbook screen has four panes, as given below. Task Pane: This pane displays the datasets and algorithms ...Creating a Workbook in Forecasting
To create a workbook, follow the steps given below. On the home page, click the Create icon (). Hover over the Forecasting tile and click the Create Workbook button. Create Workbook screen is displayed. Enter the Name for your workbook. Enter the ...