Interactivity Filter
An interactivity filter is functionality that shows the auto-responsiveness of the chart in the view mode. Using an interactivity filter, you can drill down the information given by the chart to the minute details.
Interactivity is always applied on the Dimensions.
To use the interactivity filter, follow the steps given below.
- Follow Steps 1 to Step 3 of Viewing a Dashboard.
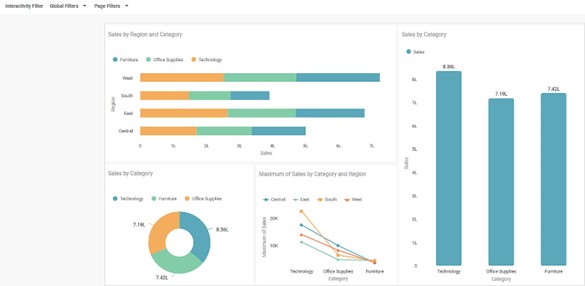
The dashboard is displayed in view mode.
- Select the widget on which you want to apply the Interactivity Filter.
- From the chart, click the column name on which you want to apply the filter.
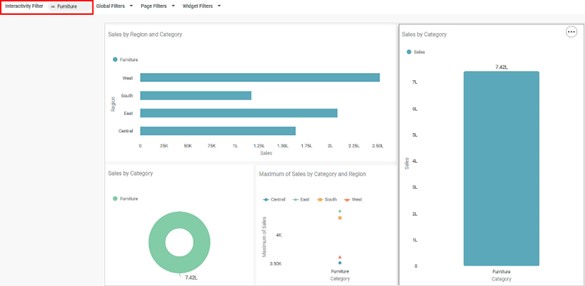
For example, here, we apply the interactivity filter on Category – Furniture.
The interactivity filter is applied to all the charts in which the selected column is present.
Related Articles
Interactivity Control
Interactivity is functionality that shows the auto-responsiveness of the chart in the view mode. We always apply interactivity to the dimensions. Using an interactivity control, you can turn interactivity ON or OFF for the preferred chart(s) that ...Page Filter
The Page Filter option is always available on the filter pane of the Dashboard canvas. The page filters apply to all the charts plotted on a page of the Dashboard. To apply a Page Filter, follow the steps given below. Create the number of charts as ...Filter Column
Filter Column in rubiscape allows to choose between the columns in the table you want to keep and remove. Also, it allows you to rename the columns and pass them to the successor node. Filter Column is located under Model Studio >> Data Preparation ...Widget Filter
Widget filters are activated when we click on a particular widget; that is, they are applied only to the selected widget. To apply widget filters, follow the steps given below. Create the number of charts as required. Refer to Creating Charts using ...Removing the Applied Filter
You can delete or clear the applied filter if it is no longer required. To remove the filter, use any of the following methods: Delete the applied condition. For this, navigate to the filtering dialog box, click the Delete icon, and then click Apply. ...