Understanding the Application Home Page
Your home page is the default workspace assigned to you as a user.
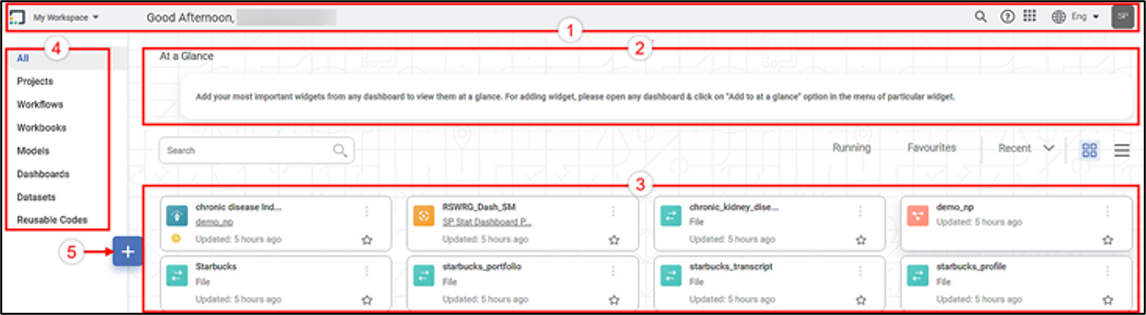
The home page has four panes and a quick tour icon, as given below.
- Title pane: This pane displays options to go to the home page and change the workspace. It also displays options to create, search globally, go to online help, and switch applications.
- Widgets pane: This pane displays the widgets that you can add from any dashboard.
- Display pane: This pane displays the list of workflows, workbooks, dashboards, datasets, and projects available in the selected workspace.
- Navigation pane: This pane displays a list of Rubiscape elements.
- Create Icon: This icon takes you to the quick tour page, where you can see and navigate directly to the various Rubiscape products.
The table below describes the fields and buttons on the Home page.
Icon/Field | Name of UI Element | Description | Remark |
| Home page icon | It is the home page icon. | You can click this icon at any point in time to return to your default workspace. |
| Workspace drop-down list | It displays the name of your current workspace. | To change the workspace, click and select the required workspace from the drop-down list. |
| Global Search icon | It helps you to search datasets, workbooks, workflows, and dashboards within your selected workspace. | Partial names are also allowed in the Search field. |
| Import Workspace | Import previously exported workspace. Workspace can only be imported in .DAT file format. | Importing a Workspace with the same name that already exists in the current workspace, will overwrite the existing Workspace, Project and associated datasets with the same name and type. |
| Help icon | It takes you to the online help file in a new browser. | ___ |
| Applications icon | It takes you to the following options.
|
|
| Language drop-down list | It displays all the available languages. | ___ |
| Profile icon | It helps you to manage the settings of your account and also log out from the application. | ___ |
| It displays the widgets that you can add from any dashboard. | You can add any important widgets from the dashboard. | |
| Search field | It helps you search workbooks, workflows, dashboards, datasets, and projects. | To search, type the text in the Search field (partial text is also allowed). |
| Running option | It displays the running workbooks, workflows, dashboards, and projects. | Select Running to display the running tasks. |
| Favorites option | It is an easy way to mark and find your items. When added to favorites, they are listed under Favorites | To add Favourites refer Favourites. |
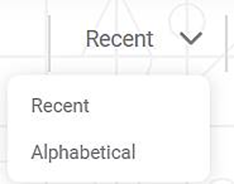
| Sort drop-down list | It helps you to sort the displayed workbooks, workflows, dashboards, datasets, and projects. | Recent: It sorts the items according to the most recent content created. Alphabetical: It sorts the items according to alphabetical order. |
| Card View icon | It displays the workflows, workbooks, dashboards, datasets, and projects in a card view. | You can mark an item as a favorite. You can also view, run, or delete them from this view. In the case of datasets, you can explore, export, edit, or delete them. |
| List View icon | It displays the workflows, workbooks, dashboards, datasets, and projects in a list view. | You can mark an item as a favorite. You can also view, run, or delete them from this view. In the case of a dataset, you can explore, export, edit, or delete it. |
| Create icon | It helps you to create,
| Navigate to the respective chapters to learn more about, |


| Notes |
|
Related Articles
RubiSight Mobile Application – Home Screen
RubiSight Mobile Application – Home Screen · The Home Screen is the default landing page after you log in to the RubiSight Mobile Application. · It provides quick access to dashboards, recent activity, and navigation menus for seamless exploration of ...Understanding the RubiThings Homepage
The RubiThings home page is the default page assigned to you to visualize the overall activity occurring in your workspace. When you log in for the first time, the home page canvas is blank. That's because you have not configured any "Thing." You see ...Understanding RubiSight Home Page
RubiSight home page is the area where you create data visualization using charts and graphs. When you create a new dashboard, the following icons and fields are displayed. The dashboard screen has four panes, as given below. Data Pane: This pane ...Drill Through from Chart to Page with Context Filtering
Drill Through Filters (Page Level) Overview Drill Through Filter option is available at the page level in the Filter Pane and is accessible from Edit/View/Outer modes. It enables navigation from one widget to another page while passing contextual ...Signing into the Application
Note: You can sign in to Rubiscape, practically from any web browser. Google Chrome is mostly recommended owing to its compatibility with the Rubiscape platform. To sign into the application, follow the steps given below. Enter the Rubiscape URL in ...