Make Sense of BI—Now at Your Fingertips with Rubiscape Mobile
In today’s
fast-paced digital world, waiting for insights is no longer an option. Business
decisions must happen in real time—whether you’re in a boardroom, on the shop
floor, or catching a flight. The traditional desktop-bound BI model no longer
meets the demands of today’s always-on workforce.
That’s
where Rubiscape Mobile steps in—not just as a companion to your analytics
platform, but as a game-changer in how insights, approvals, and actions flow
across your organization.
Rise of Mobile-First Intelligence
As
businesses become increasingly decentralized and agile, mobile analytics is
evolving from a “nice-to-have” to an absolute necessity. Decision-makers—from
CXOs and analysts to frontline managers—need the freedom to access critical
KPIs, monitor performance trends, and approve workflows without being tied to a
desk.
With the Rubisight Mobile App, we’re putting
real-time intelligence right in your pocket. Imagine the ability to:
- View interactive dashboards on the go
- Receive alerts and notifications for anomalies or approvals
- Collaborate and share insights instantly with teams
- Make confident, data-driven decisions from anywhere
Whether you're tracking sales performance, supply chain
metrics, or financial health, mobile BI ensures you're never out of touch with
your business reality.
Immersive Data Visualizations
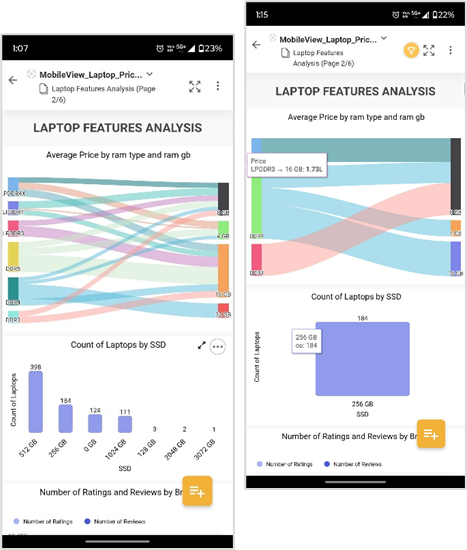
Dynamic Charts & Visuals: Bring your data to life
with a rich library of visualizations—from bar and line charts to pivot tables,
KPI widgets, and advanced dashboards. Explore trends, patterns, and anomalies
like never before.
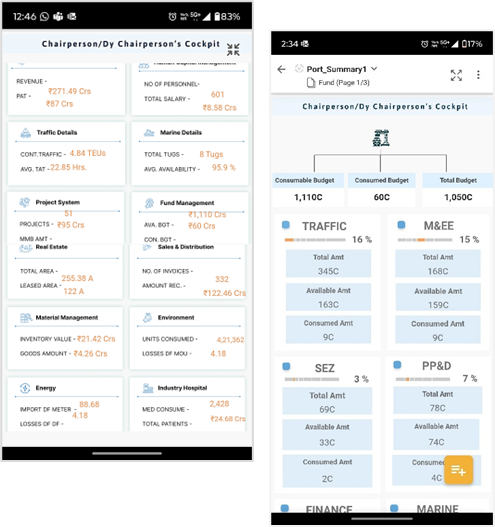
Interactive Dashboards: Design personalized
dashboards with easy drag-and-drop functionality. Reorder, resize, and
customize widgets to create a real-time, 360° view of your business
metrics—tailored to your goals.
Seamless
Touch Interaction
Interactive Gestures: Experience intuitive data
exploration with the power of touch. Navigate and analyse your data
effortlessly using familiar gestures.
Touch Navigation: Tap, swipe, and pan your way
through charts, dashboards, and reports—making data interaction feel as natural
as using your favourite mobile apps.
Drill-Down Capabilities: Dive deeper into insights
with a single tap. Instantly access detailed views by interacting directly with
charts, widgets, and visual elements for richer context and better decisions.
Self-organized
Visualization
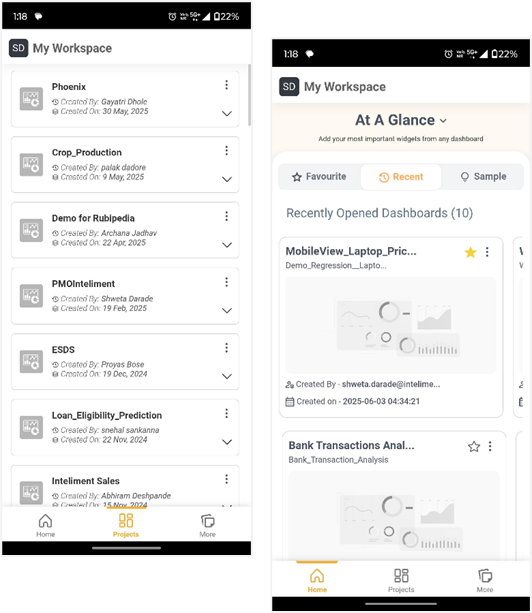
Rubisight Analytics - Mobile BI app organizes reports
and dashboards automatically and allows you to mark favourites for quick
access.
Automatic organization: Categorize reports by type,
folders, and relationships.
Favourites: Access important reports quickly with a single
tap.
Secure, Seamless, Scalable: Enjoy role-based access,
encrypted data, and SSO support for secure yet effortless access to insights.
Our SaaS-ready architecture ensures smooth performance—any device, anytime.
Smart Collaboration
Without Boundaries
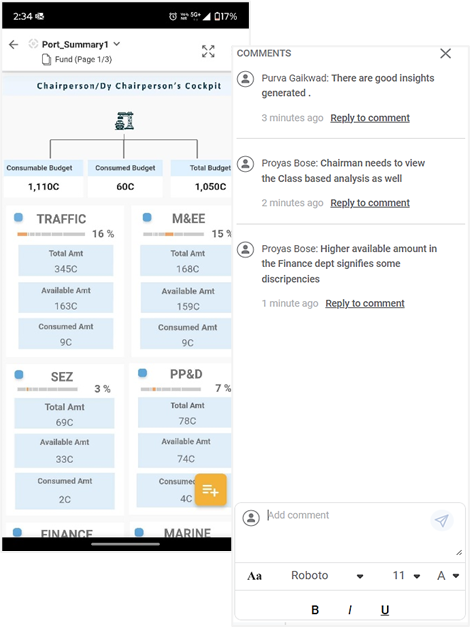
Collaborate
seamlessly with your team by sharing insights and dashboards and setting
permissions to control access.
Role-based
sharing: Share reports with specific team members with a fine-tuned access
control.
Commenting:
Add comments to reports and dashboards to facilitate discussions and
drive decisions.
Annotation:
Annotate your key insights
Rubiscape puts the power of analytics in your
pocket—so every decision is informed, agile, and unstoppable.
Go Beyond
Desktops—Lead with Mobility
Explore how Rubisight
Mobile can fit your business needs. Whether you’re an existing Rubiscape user
or evaluating enterprise-grade analytics, our mobile-first approach ensures you
never miss a beat.
Stay
online. Stay updated. Stay ahead. With Rubiscape Mobile.
to learn more.
Recent Topics
Grid in RubiSight
Rubi AI
From Numbers to Insights, EV Sales Intelligence Dashboard is Live!
Electric Vehicles are not just a trend anymore… they are reshaping mobility in India. So instead of looking at static reports, we built something decision-makers can actually use. We’re excited to share our EV Sales Analytics Dashboard (FY 2023–2024)Air Quality Insights Across Indian Metros
As the festive season fills the skies with lights, it’s also important to keep an eye on what’s in the air we breathe. 🌫️ Rubiscape presents the Air Quality Insights a visual exploration of how pollution levels change across Indian metros, especiallyThe Smart Way to Highlight Insights: Conditional Formatting in RubiSight
When you look at a dashboard, what’s the first thing that grabs your attention? Chances are, it’s the colours. Imagine scanning through a sales report where declining revenues are instantly highlighted in red, while top-performing regions glow in green.Bug in RubiFlow Scheduler
I was trying to 'Schedule' option in my rubiflow, there I filled all the appropriate fields. But when I try to click on the 'active' option, then 'update'. but still the status of that scheduler is 'deactive'. basically the scheduler is not saving theRooted in Data: Visualizing India’s Agricultural Story
Indian agriculture has always been a story of complexity and uncertainty, shaped by shifting weather patterns, rising input costs, and vast regional differences in productivity. For decades, the data holding the key to these challenges has been fragmentedMake Sense of BI—Now at Your Fingertips with Rubiscape Mobile
In today’s fast-paced digital world, waiting for insights is no longer an option. Business decisions must happen in real time—whether you’re in a boardroom, on the shop floor, or catching a flight. The traditional desktop-bound BI model no longer meetsShowroom to Service Bay: How Rubiscape Redefines Automotive Intelligence
In today’s data-driven world, the automotive industry is experiencing rapid transformation. With evolving customer preferences, rising competition, and the growing importance of after-sales services, the need for deeper, data-backed decision-making hasWhat truly powers great dashboards, sharp analytics, and confident decision-making?
It’s not just the tools we use — it’s the foundation beneath them. Let’s shine a light on the unsung heroes of Business Intelligence — the essential elements that transform raw data into trusted insights: Data Modeling: Designing with Purpose Every strongA Deep Dive into Christmas Gift Sales Analysis using Rubisight
Unwrapping the Festive Cheer: A Deep Dive into Christmas Gift Sales The holiday season is a time of joy, cheer, and, of course, gift-giving. As retailers gear up for the next festive season, understanding the nuances of consumer behaviour and sales trendsUnwrapping the Festive Cheer: A Deep Dive into Christmas Gift Sales Analysis
Unwrapping the Festive Cheer: A Deep Dive into Christmas Gift Sales The holiday season is a time of joy, cheer, and, of course, gift-giving. As retailers gear up for the next festive season, understanding the nuances of consumer behaviour and sales trendsI have a doubt
What are the differences between supervised and unsupervised learning?Building structured data storage strategy for Things data
IOT data packets are generally dependent on the sensors, devices ,gateways, systems that generate them. Also this data can be structured or unstructured. For the sake of this post lets talk about structured data and challenges to build a mechanism ofAbout the RubiStudio category
This category consists of all topic discussions related to data preparation & modeling, machine learning, forecasting, textual analytics, and Pro Code possible with RubiStudio.Quick Use of Data Dictionary and Workflow
Data Dictionary: With the use of pre-existing datasets, a new data dictionary can be produced. It enables you to create new datasets while reusing the existing ones and incorporating new features. By leveraging the preexisting datasets, the Data DictionaryFlow of Information using Sankey Chart in RubiSight
A Sankey chart, also known as a Sankey diagram or flow diagram, is a type of data visualization that represents the flow of resources, energy, or other quantities between multiple entities or categories. It is often used to visualize the distributionSecuring Your Data at Every Level: Introducing Rubisight’s Data Level Security
In the digital age, data governance and security have emerged as paramount concerns for organizations across industries. With the proliferation of data breaches and regulatory requirements, safeguarding sensitive information and ensuring compliance hasInfographics and Specialized Widgets: When to Use, Best Practices, and Limitations
RubiSight widgets, also known as charts, are the building blocks of visual data storytelling dashboards within the Rubiscape platform. They are essentially visual representations of your data that help you explore, understand, and communicate insightsHow to include drill-down to details option?
Question - For example, I have 10 records. 7 of which are ok, 3 are not ok. On dashboard I want to show count and aggregated values for 7 and 3 respectively. And details of 3 or 7 records should be available on user demand. There are two ways to drillUse of HTML for Bookmarking in Rubisight
What is bookmarking? How do we achieve it using Power BI? Bookmarking is a common feature in various data visualization tools, and it generally refers to the ability to save and revisit a specific state or view of a report/dashboard. This feature allowsRubisight Filters Explained: Finding Insights Faster
Rubisight filters help you focus on specific data within your dashboard, making it easier to spot trends and gain valuable insights. Here are the three main types: 1. Global Filters: Apply the same filter criteria to all pages on a dashboard. Useful forBanking Analytics: Reimagining the Way Banks Do Business
Created a Comprehensive dashboard on Banking Analytics. With banking products becoming increasingly commoditized, Analytics can help banks differentiate themselves and gain a competitive edge. This dashboard showcase trends that help management in decisionRubisight Overview - Key Functionalities
Find the dashboard used in Rubisight Overview Session. This dashboard demonstrated most of the functionalities in Rubisight platform. The funcationalities used in the dashboard are as follows - Data Dictionary used for Rubisight dashboard creation. CalculatedLeBron James vs. Michael Jordan: The Greatest Debate in Basketball History
My new Viz on Rubisight Shapes - This entire dashboard is prepared based on shapes and filters. The debate over who is the greatest basketball player of all time, LeBron James or Michael Jordan, has captivated fans and analysts for years. Both athletesOutlier Detection
Outlier Detection Description Outlier Detection reveals the extreme values that deviate from the rest of the data in a real-world dataset. Why to use Numerical Analysis – Data Preparation When to use When there are certain values in the data which significantlyHardik vs Rohit - An Inhouse Rivalry!
The Big Debate - Hardik vs Rohit ---- Mumbai Indians are already out of the IPL and whose fault !!! Is it Hardik ??? The news sources are debating on the two former Indian Player, is it a correct debate ? image723×712 181 KB Find the stats in RubisightHow to convert the data type for a specific data point in Rubiflow?
In Rubiflow once the data node is processed, you can use an expression from the Data preparaion function (Data integration) and connect to the data source node. In that you will be able to see a functions on the left side - “Convert”, through this functionalityWelcome to Community
The Community hub inside Zoho Desk lets you build a powerful community around your business, while still serving customers via other channels. Your customers can post 4 types of content within your community. These are Ideas, Questions, Problems and Discussions.
Topic Participants
proyas.bose